Troubleshooting
Enterprise Server has a built-in troubleshooting tool that collects and analyzes logs and system metrics to help identify issues with the cluster.
Generate Support bundle from the admin console
To generate a support bundle (archive of application logs):
- Run the command
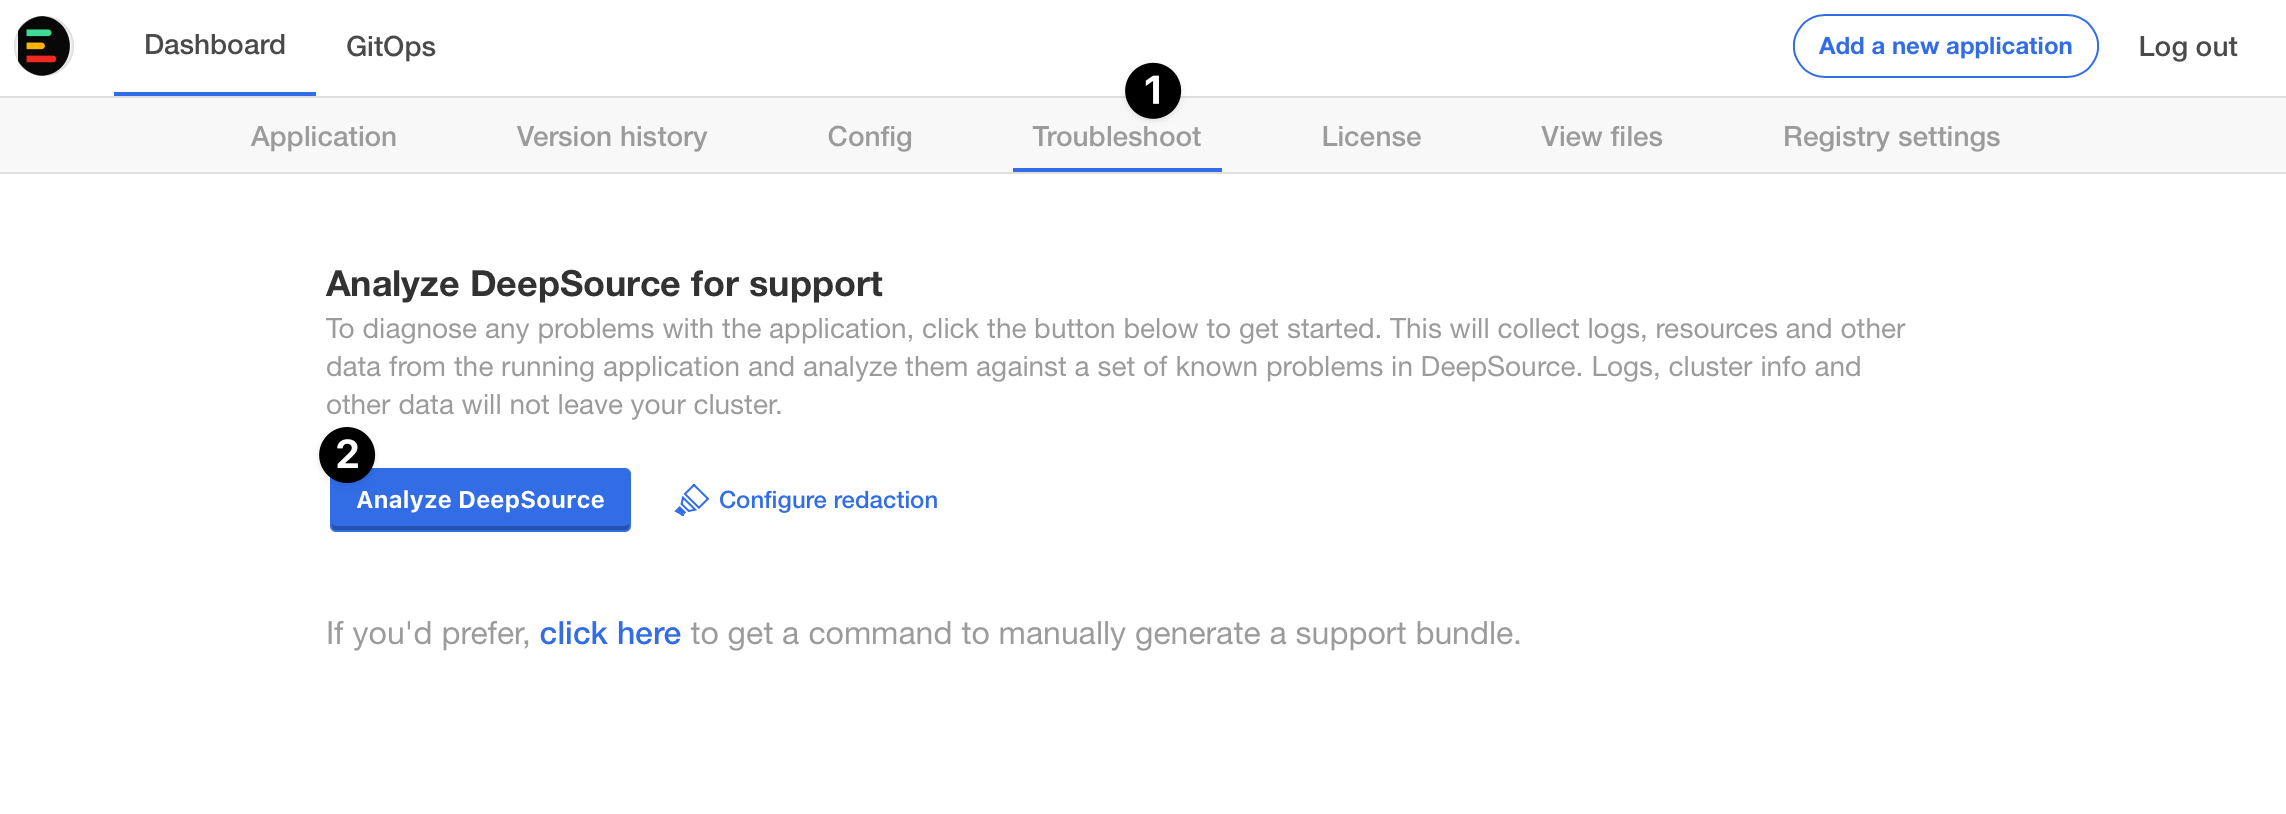
kubectl set env deploy/kotsadm -n <namepspace> KOTSADM_LOG_LEVEL=debug(namespace isdefaultfor Standalone Cluster installations) - Navigate to Application->Troubleshoot section in your Admin console.
- Click on the Generate a support bundle button.
- Click Analyse DeepSource button.
- If you need help from DeepSource Support Engineering team, you can press Send bundle to vendor to send the support bundle to DeepSource Engineering team.

Generate Support bundle from CLI
If you are unable to access the Admin Console for any reason, you can run the command below to generate a support bundle from the CLI:
curl https://krew.sh/support-bundle | bash
kubectl support-bundle --interactive=true https://assets.enterprise.deepsource.com/kots/support-bundle.yaml
Allow a few minutes for the above command to finish execution. Select quit[q] for the checks that run at the end. The support bundle will be saved in the directory the command is executed from. The support bundle file will look something like support-bundle-2022-09-29T04_05_00.tar.gz.
Auto forward errors to DeepSource
You can configure Enterprise Server to send Sentry alerts to the DeepSource team whenever an error occurs in the application.
Configuration
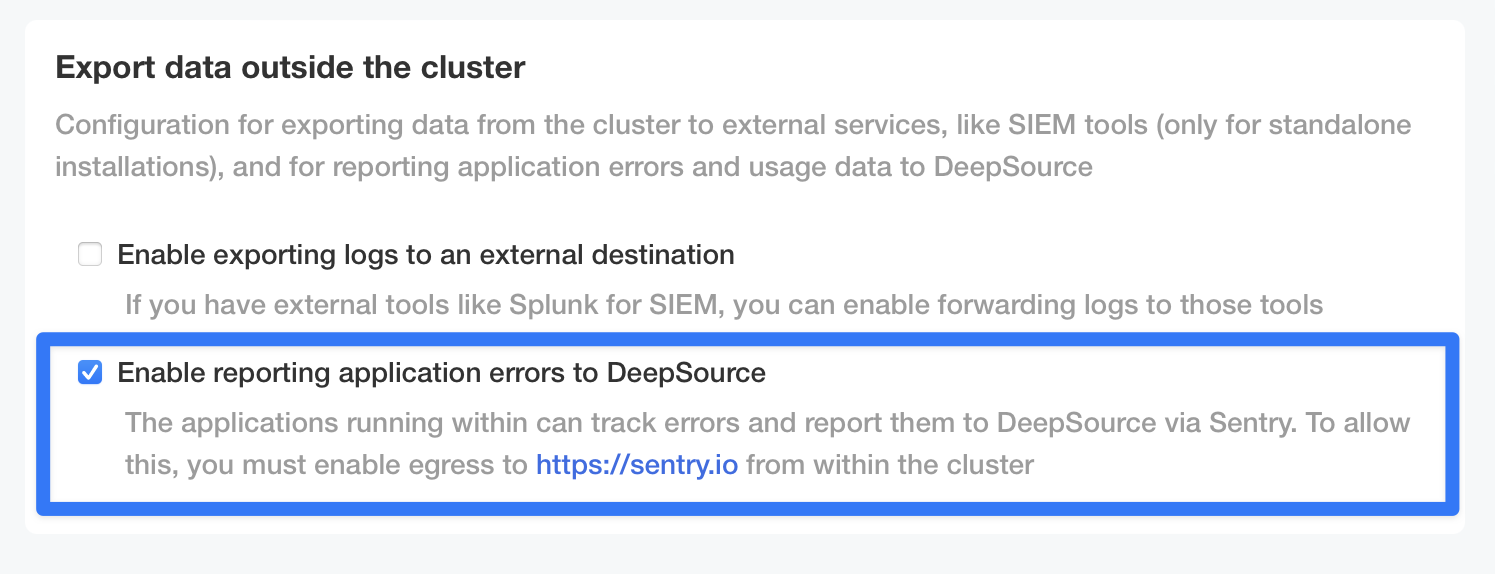
To configure Sentry for your DeepSource installation, you will need to go to the Admin Console and scroll to the section "Export data outside the cluster" section. Then select the "Enable reporting application errors to DeepSource" option.

Notes:
- You will also need to allow egress to https://sentry.io from the cluster.
- A DSN is already set in your license, so you may have to sync your license (go to Admin Console -> License -> click on Sync License) and redeploy before you can use Sentry.
Why should I send application errors to DeepSource through Sentry?
The way that DeepSource Support Engineering team currently debugs application errors on your Enterprise Server installation is through support bundles. Usually, however, the users who use the DeepSource application are not the users who have access to the admin console or application logs. Between facing issues with the application and generating and sending a support bundle, it adds a lot of friction before the issue can actually be seen by the DeepSource Support Engineering team and get fixed.
When you enable Sentry for your installation, DeepSource Support Engineering team immediately gets notified about the issue and can help with a fix as quickly as possible.
Setup log forwarding
Enterprise Server lets you forward system and application logs to a log aggregation system of your choice. This can be easily configured from the Config section of the Admin Console.
- To get started with log forwarding, check the
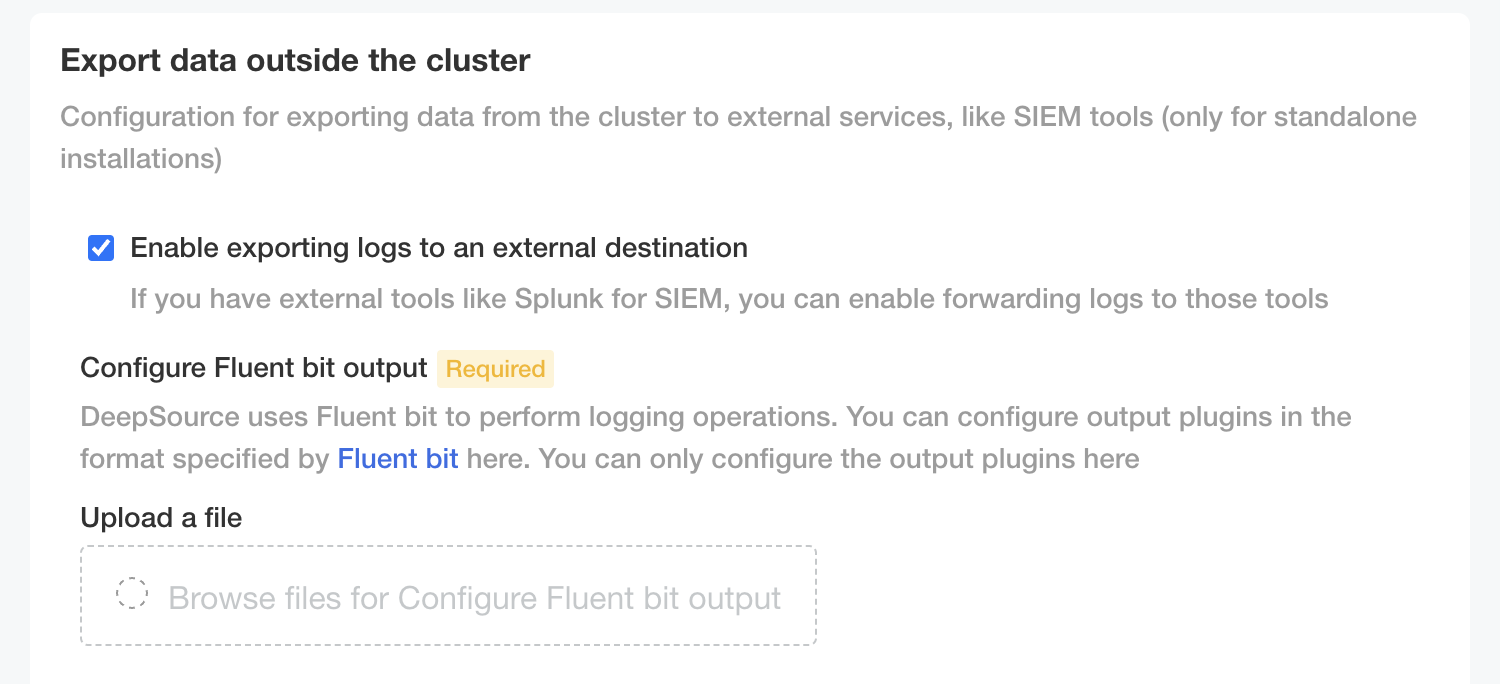
Enable exporting logs to an external destinationin the Config section.

- Upload a file with the output block of the Fluent Bit configuration file. A full list of available output plugins can be found here.
Note: Log forwarding is only supported in standalone cluster installations.
Sample Configuration
This is a sample configuration for sending logs to an HTTP endpoint.
[OUTPUT]
    Name  http
    Match *
    Host  192.168.2.3
    Port  80
    URI   /something
RabbitMQ stuck in CrashLoopBackoff state
There are some releases where we change the RabbitMQ definitions for introducing new queues and ideally, RabbitMQ pods should restart automatically. However, if the configuration reload fails and RabbitMQ gets stuck in CrashLoopBackoff we recommend the following procedure to fix it:
- Downscale the RabbitMQ StatefulSet
kubectl scale sts/rabbitmq --replicas=0 - Upscale the RabbitMQ StatefulSet
kubectl scale sts/rabbitmq --replicas=3
Generate Cluster Support Bundle
Sometimes the normal support-bundle is not enough to diagnose the issue and we might ask you to generate a cluster support-bundle for in-depth information. To generate a support-bundle from CLI, run the following command:
curl https://krew.sh/support-bundle | bash
kubectl support-bundle --interactive=true --load-cluster-specs https://raw.githubusercontent.com/replicatedhq/troubleshoot-specs/main/in-cluster/default.yaml  https://raw.githubusercontent.com/replicatedhq/troubleshoot-specs/main/host/default.yaml
Analysis runs are timing out
After some deployments, the order of the restart of the application pods might not sync with the restart of the core services. Due to this, all analysis runs may start timing out. To fix it, follow these steps:
kubectl scale sts/rabbitmq --replicas=0
# wait for some time
kubectl scale sts/rabbitmq --replicas=2
# wait for the rabbitmq pods to be ready
kubectl rollout restart deploy/atlas
kubectl rollout restart deploy/asgard-celery-servecelery
kubectl rollout restart deploy/asgard-celery-serveanalysis
kubectl rollout restart deploy/asgard-celery-serveanalytics
Admin/Superusers not updated
In some cases, even after redeploying the application with updated superusers it's not reflected in the control panel. To fix this you can try re-running the following script to update the superusers.
kubectl exec -n <deepsource-application-namespace> deploy/asgard-main asgard-main -- bash -c 'python manage.py update_superusers'Avatars are not synced
To sync the user and owner avatars manually from version control systems, run the following scripts:
Sync owner avatars
kubectl exec -it deploy/asgard-main asgard-main -n <deepsource-appplication-namespace> -- bash --noediting -ci 'python manage.py runscript add_missing_avatars_for_owner'Sync user avatars
kubectl exec -it deploy/asgard-main asgard-main -n <deepsource-appplication-namespace> -- bash --noediting -ci 'python manage.py runscript add_missing_avatars_for_user'