
Slack
Send event alerts to your channels

The Slack integration requires the Team or Enterprise plan.
By integrating with Slack, DeepSource can directly send updates to your workspace. Once enabled, you will receive notifications regarding the following events:
- New issues introduced in the default branch.
- Issues resolved in the default branch.
- Issues fixed with Autofix™.
- Repository activation status changed.
Installation
To install the integration for Slack follow these steps:
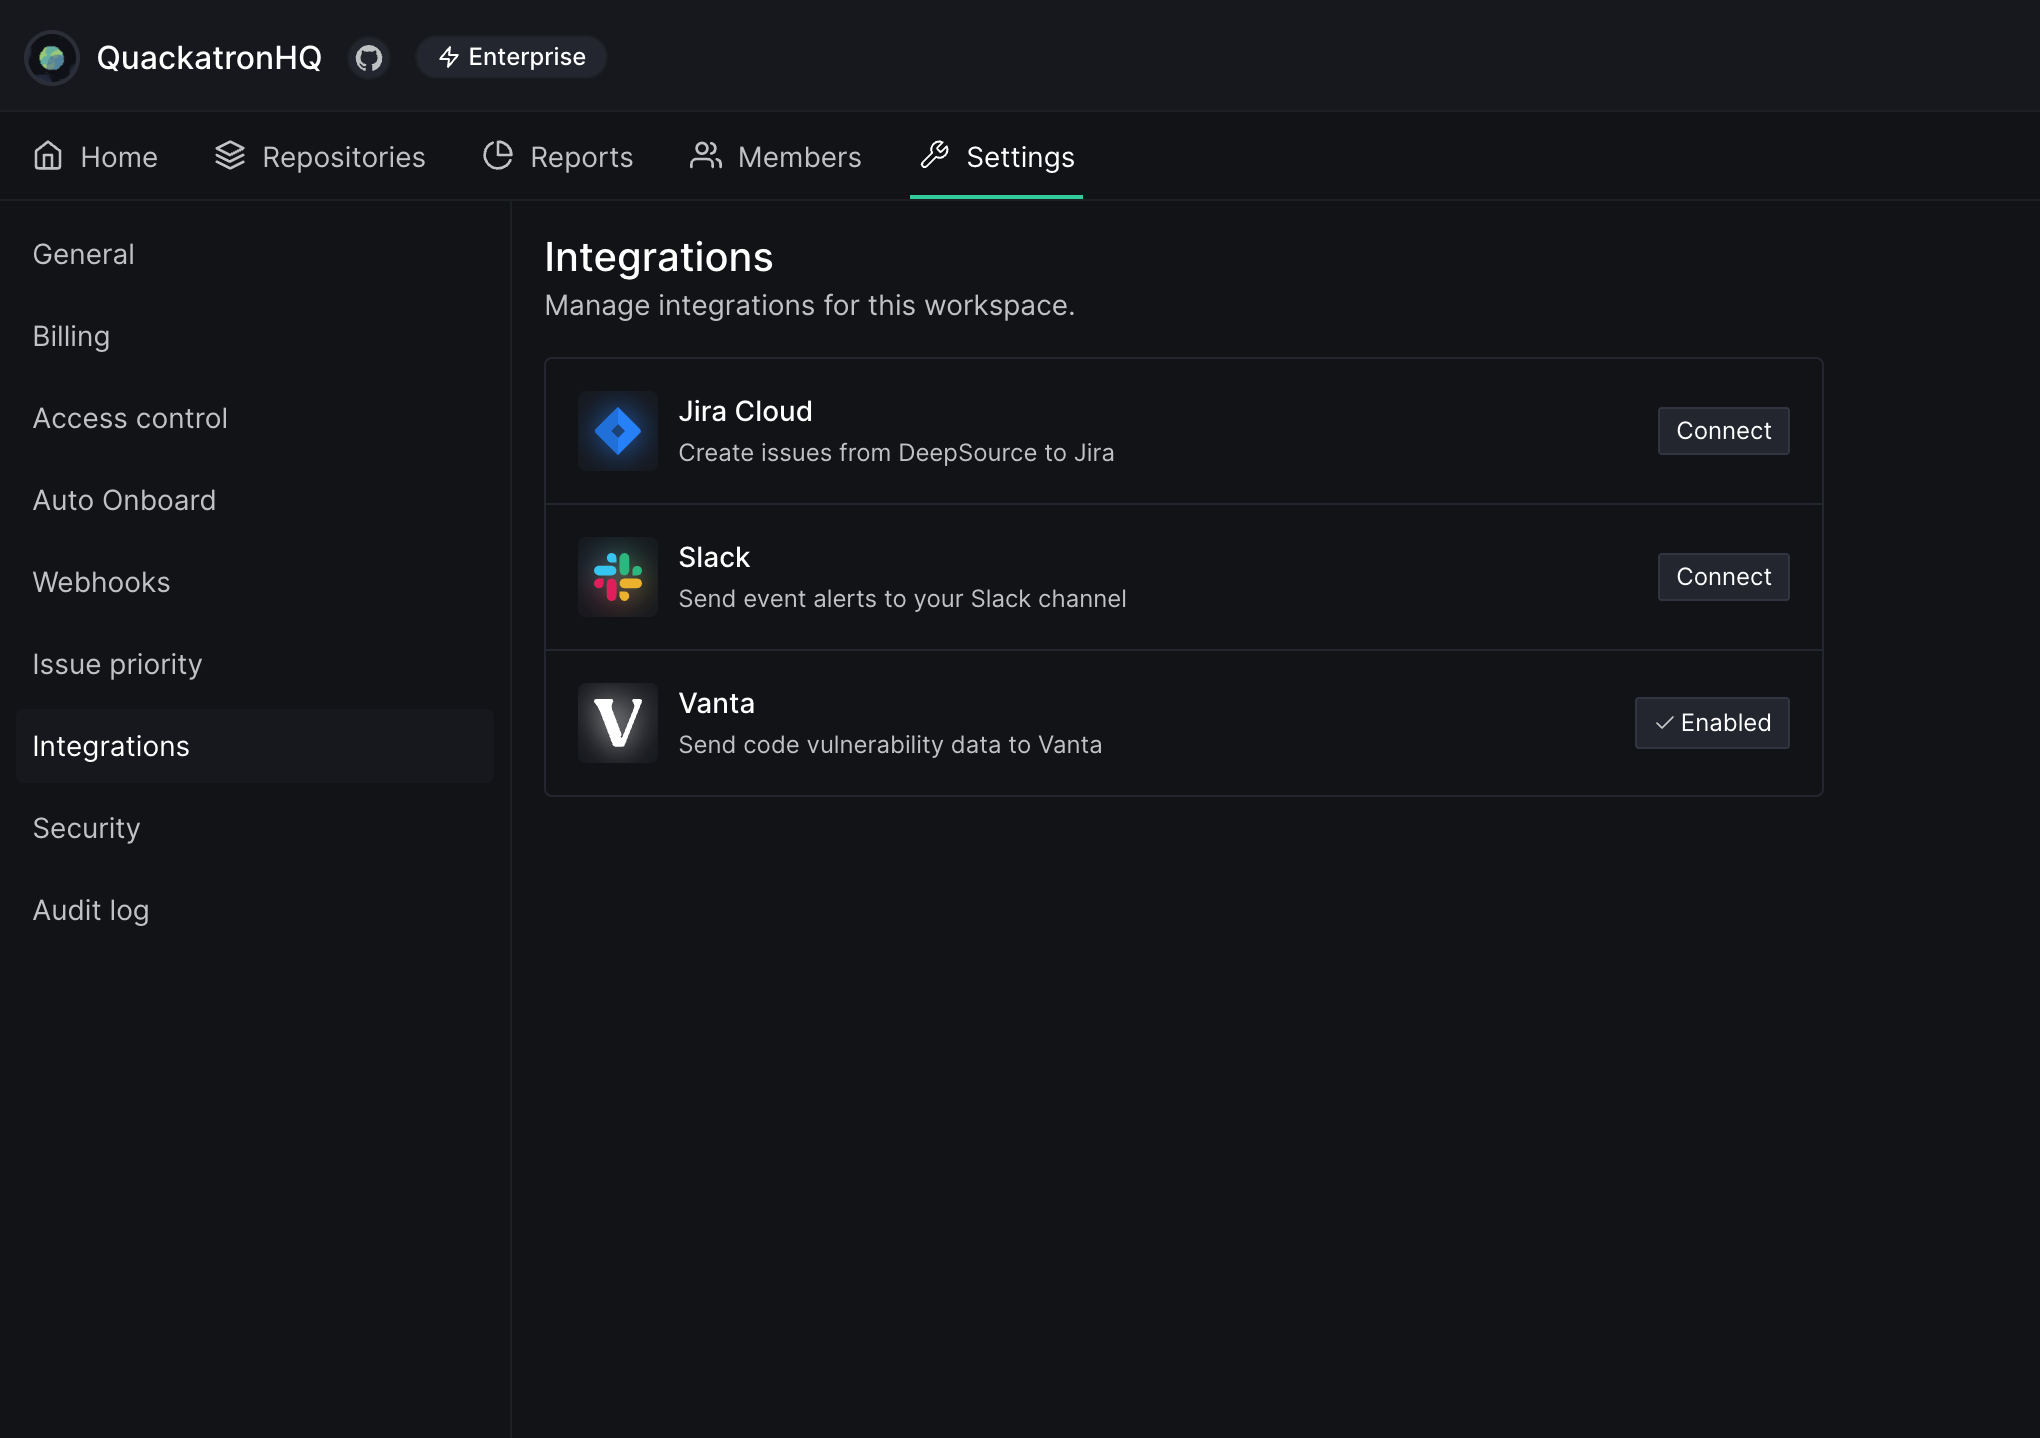
- Go to Settings from the sidebar and navigate to the Integrations tab.
- Click on the Slack card.
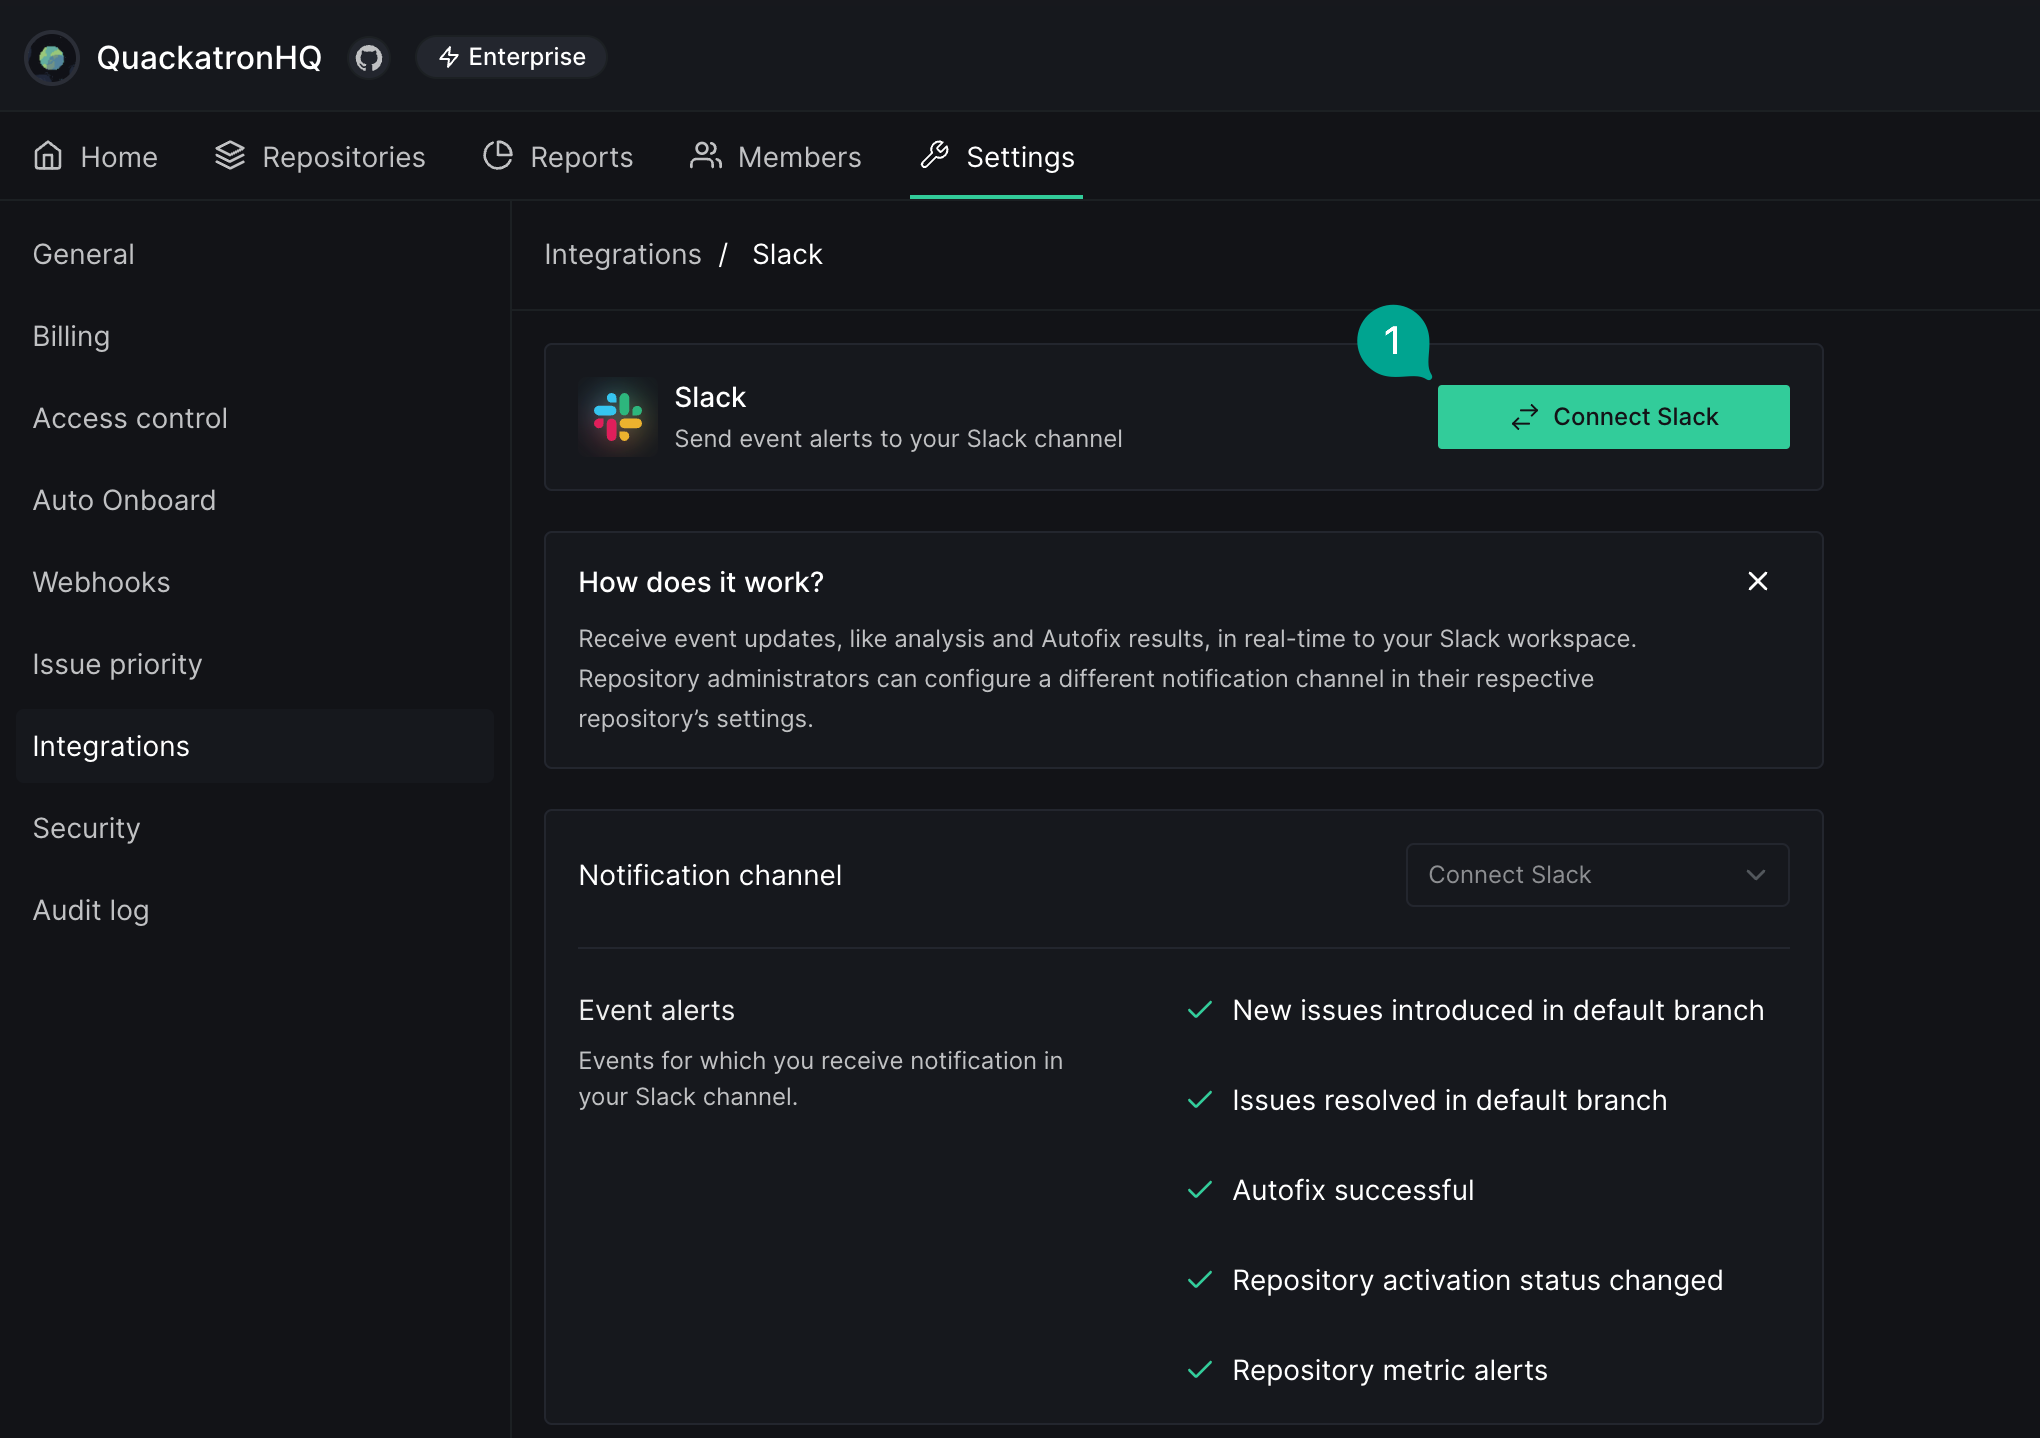
- Click Install integration to open Slack's authorization page.
- In the authorization page select the Slack workspace you'd like to install this app to and click on Allow.
- Select the Notification channel and click on Install integration.
Updating the notification channel
To change the Slack notification channel:
- Go to Settings from the sidebar and navigate to the Integrations tab.
- Click on the Slack card.
- If the integration is installed you should see the option to change the notification channel.
Setting a different notification channel for specific Repositories
To change the Slack notification channel for a specific Repository:
- Go to your repository's settings and select Integrations in the settings sidebar.
- Select the Slack card.
- Assign the notification channel for this repository.
Uninstalling
To uninstall the integration:
- Go to Settings from the sidebar and navigate to the Integrations tab.
- Click on the Slack card.
- Click Uninstall Slack and confirm.
Privacy policy
To learn more about how we collect, keep, and process your private information, please view our privacy policy.