
Track code coverage
Enabling Code Coverage will show you coverage metrics like Line Coverage, Branch Coverage, Condition Coverage, and, Composite Coverage. The Analyzer also looks at lines of code that were never executed by any tests and raises actionable issues for them.
Enable the Test Coverage Analyzer
Enable the Test Coverage Analyzer through the dashboard under Settings > Code Review.
Send coverage reports
No secrets to manage. GitHub Actions provides OIDC tokens that the CLI exchanges for temporary access.
Using GitLab, Bitbucket, or Azure DevOps? OIDC is supported for GitHub Actions only — use the DSN tab instead.
Add permissions to your workflow
Add the permissions block to your GitHub Actions workflow file:
permissions:
  id-token: write
  contents: read
Install DeepSource CLI
curl -fsSL https://cli.deepsource.com/install | BINDIR=./bin shBINDIR=./bin tells the installer to place the deepsource binary in ./bin relative to your working directory, so CI scripts can reference ./bin/deepsource.
Report coverage
./bin/deepsource report --analyzer test-coverage --key <key> \
  --value-file <path-to-coverage-report> --use-oidc
In the above command, <key> is the language for which you'd be sending the coverage report.
Set up DEEPSOURCE_DSN environment variable
DSN is used to associate the coverage artifact to the repository. This needs to be configured before sending a coverage artifact for analysis.
To look up the DSN:
- Go to the Settings page of the repository dashboard in DeepSource
- Go to the Code Coverage Section
- Click on Copy button to copy your DSN.
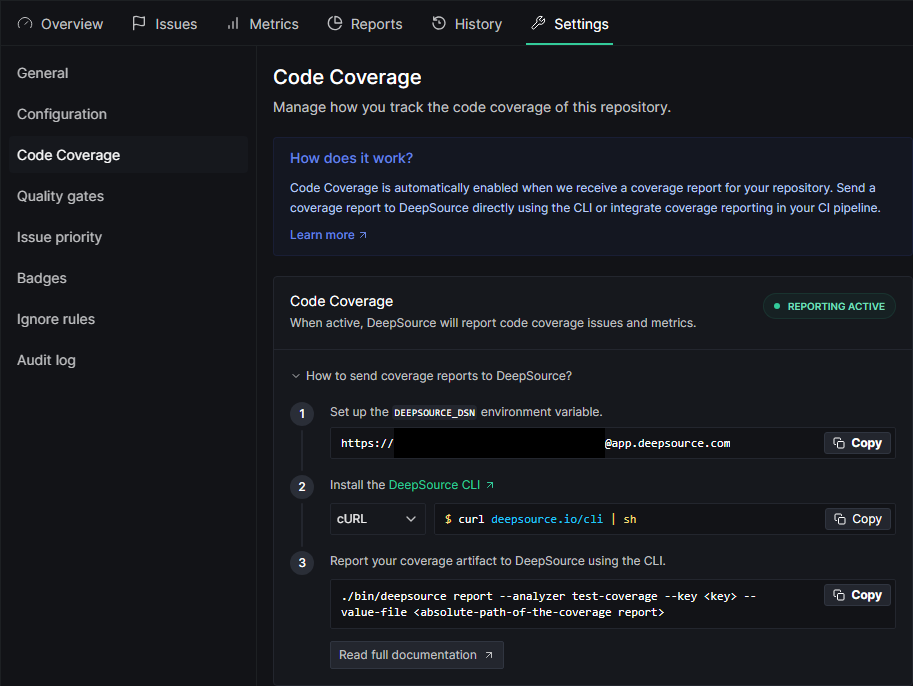
Once you get the DSN, please make sure you store it as an environment variable named DEEPSOURCE_DSN in your CI's environment.
Install DeepSource CLI
curl -fsSL https://cli.deepsource.com/install | BINDIR=./bin shBINDIR=./bin tells the installer to place the deepsource binary in ./bin relative to your working directory, so CI scripts can reference ./bin/deepsource.
Report coverage
./bin/deepsource report --analyzer test-coverage --key <key> --value-file <path-to-coverage-report>In the above command, <key> is the language for which you'd be sending the coverage report.
- List of supported languages and coverage formats can be found on the Code coverage page.
- Please refer to the CLI documentation for more on the
reportcommand.
Always run the deepsource report command from the root of your repo. This ensures filepaths in the test reports are handled correctly.
The maximum allowed size for the coverage report file is 20 MB.
The Metrics page displays coverage trends for the default branch only. If you only upload coverage on feature or PR branches, Metrics will show "Not enough data." Make sure your CI pipeline uploads coverage on pushes to the default branch, or enable Report Inference in Settings > Code Coverage to infer coverage from PR branches onto the default branch.
Next steps
- CI provider guides — boilerplate config for Travis CI, Circle CI, GitHub Actions, GitLab CI, Heroku CI, and Azure Pipelines
- Docker coverage — reporting coverage from inside or outside a Docker container
- Multiple reports — merging partial coverage reports from multiple CI pipelines