
Overview
The Overview tab provides a snapshot of your repository's code health, including issue counts by category, key metrics, and pinned reports.
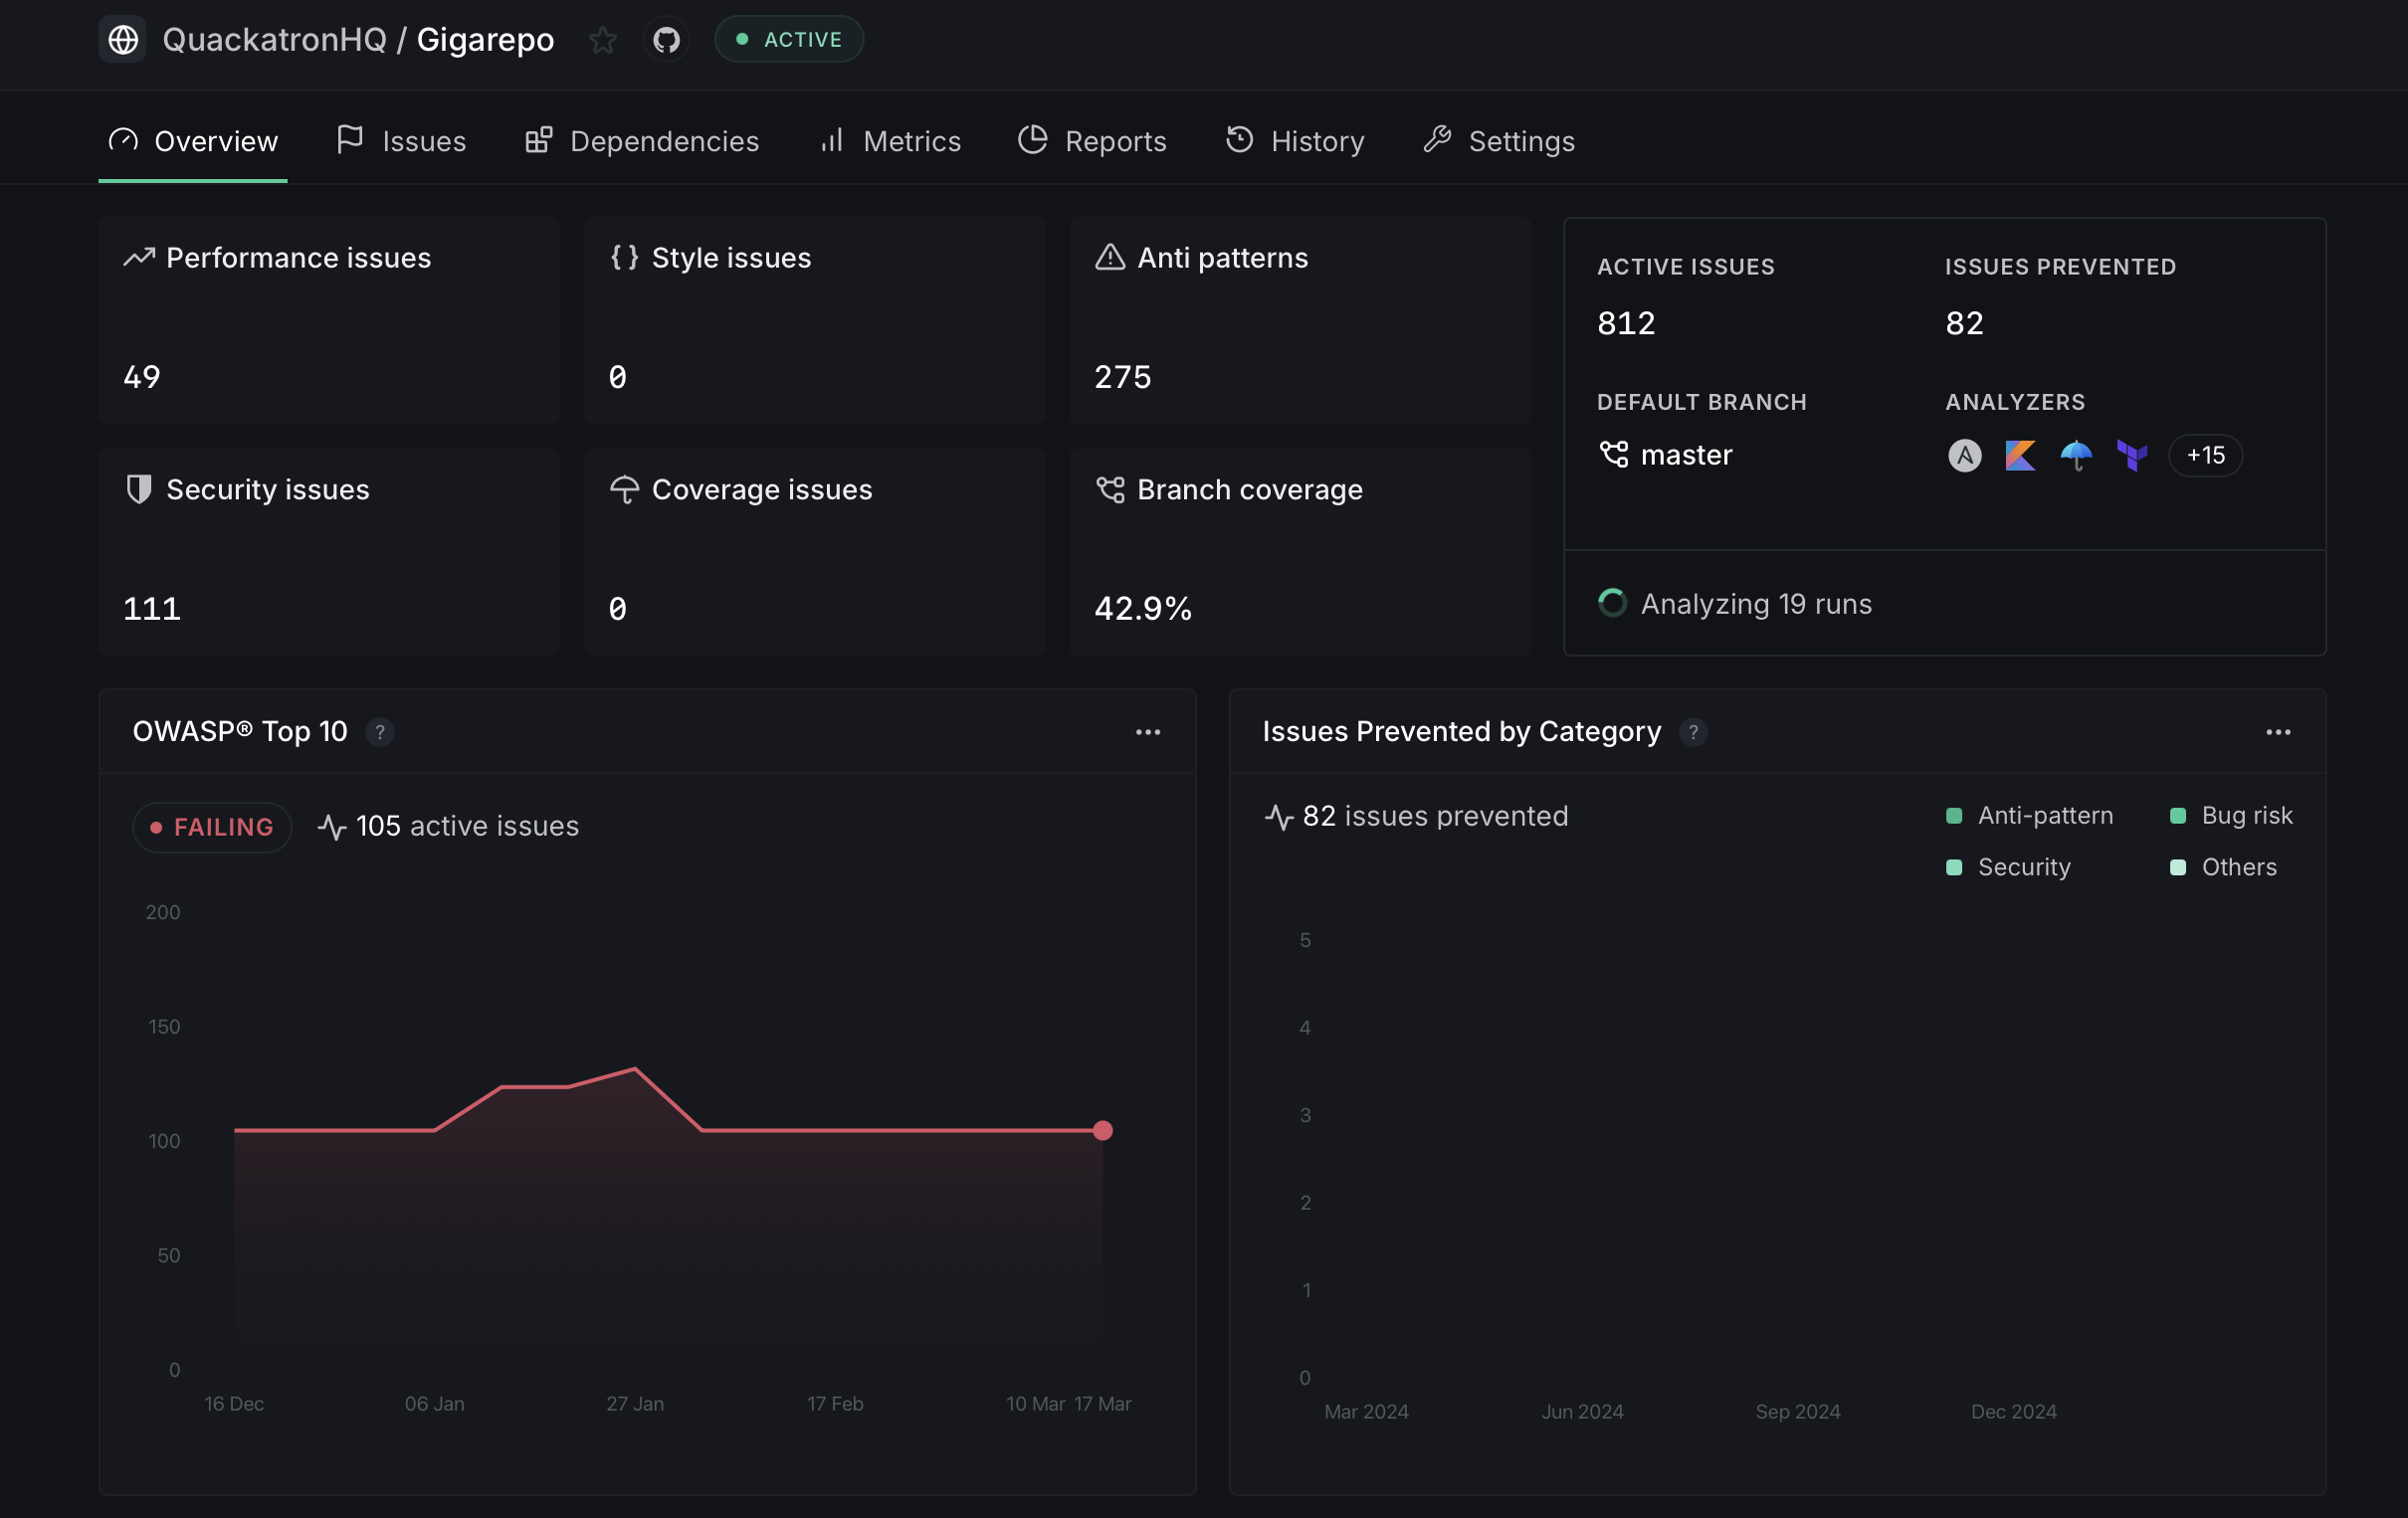
The Overview tab gives you a high-level summary of your repository's code health at a glance.
Issue summary
The top section displays a breakdown of active issues by category:
- Performance issues — Issues affecting runtime performance
- Style issues — Code style and formatting violations
- Anti patterns — Known bad coding practices
- Security issues — Potential security vulnerabilities
- Coverage issues — Code coverage gaps
- Branch coverage — Percentage of branches covered by tests
Each card shows the current count for that category, giving you a quick view of where your codebase needs the most attention.
Repository stats
The right-side panel shows key statistics:
- Active Issues — Total number of unresolved issues in the repository
- Issues Prevented — Number of issues caught and prevented from merging
- Default Branch — The branch being analyzed
- Analyzers — The active analyzers configured for this repository, along with the current analysis status
Pinned reports
Below the issue summary, you can pin up to four reports that are most relevant to your repository. These reports display data specific to the repository and update automatically. Click the ... icon on any pinned report to change the time period or swap it for a different report.
Available reports include security compliance reports (like OWASP Top 10) and insight reports (like Issues Prevented by Category).