
History
View analysis history, PR Report Card grades, and detailed issue breakdowns for each run.
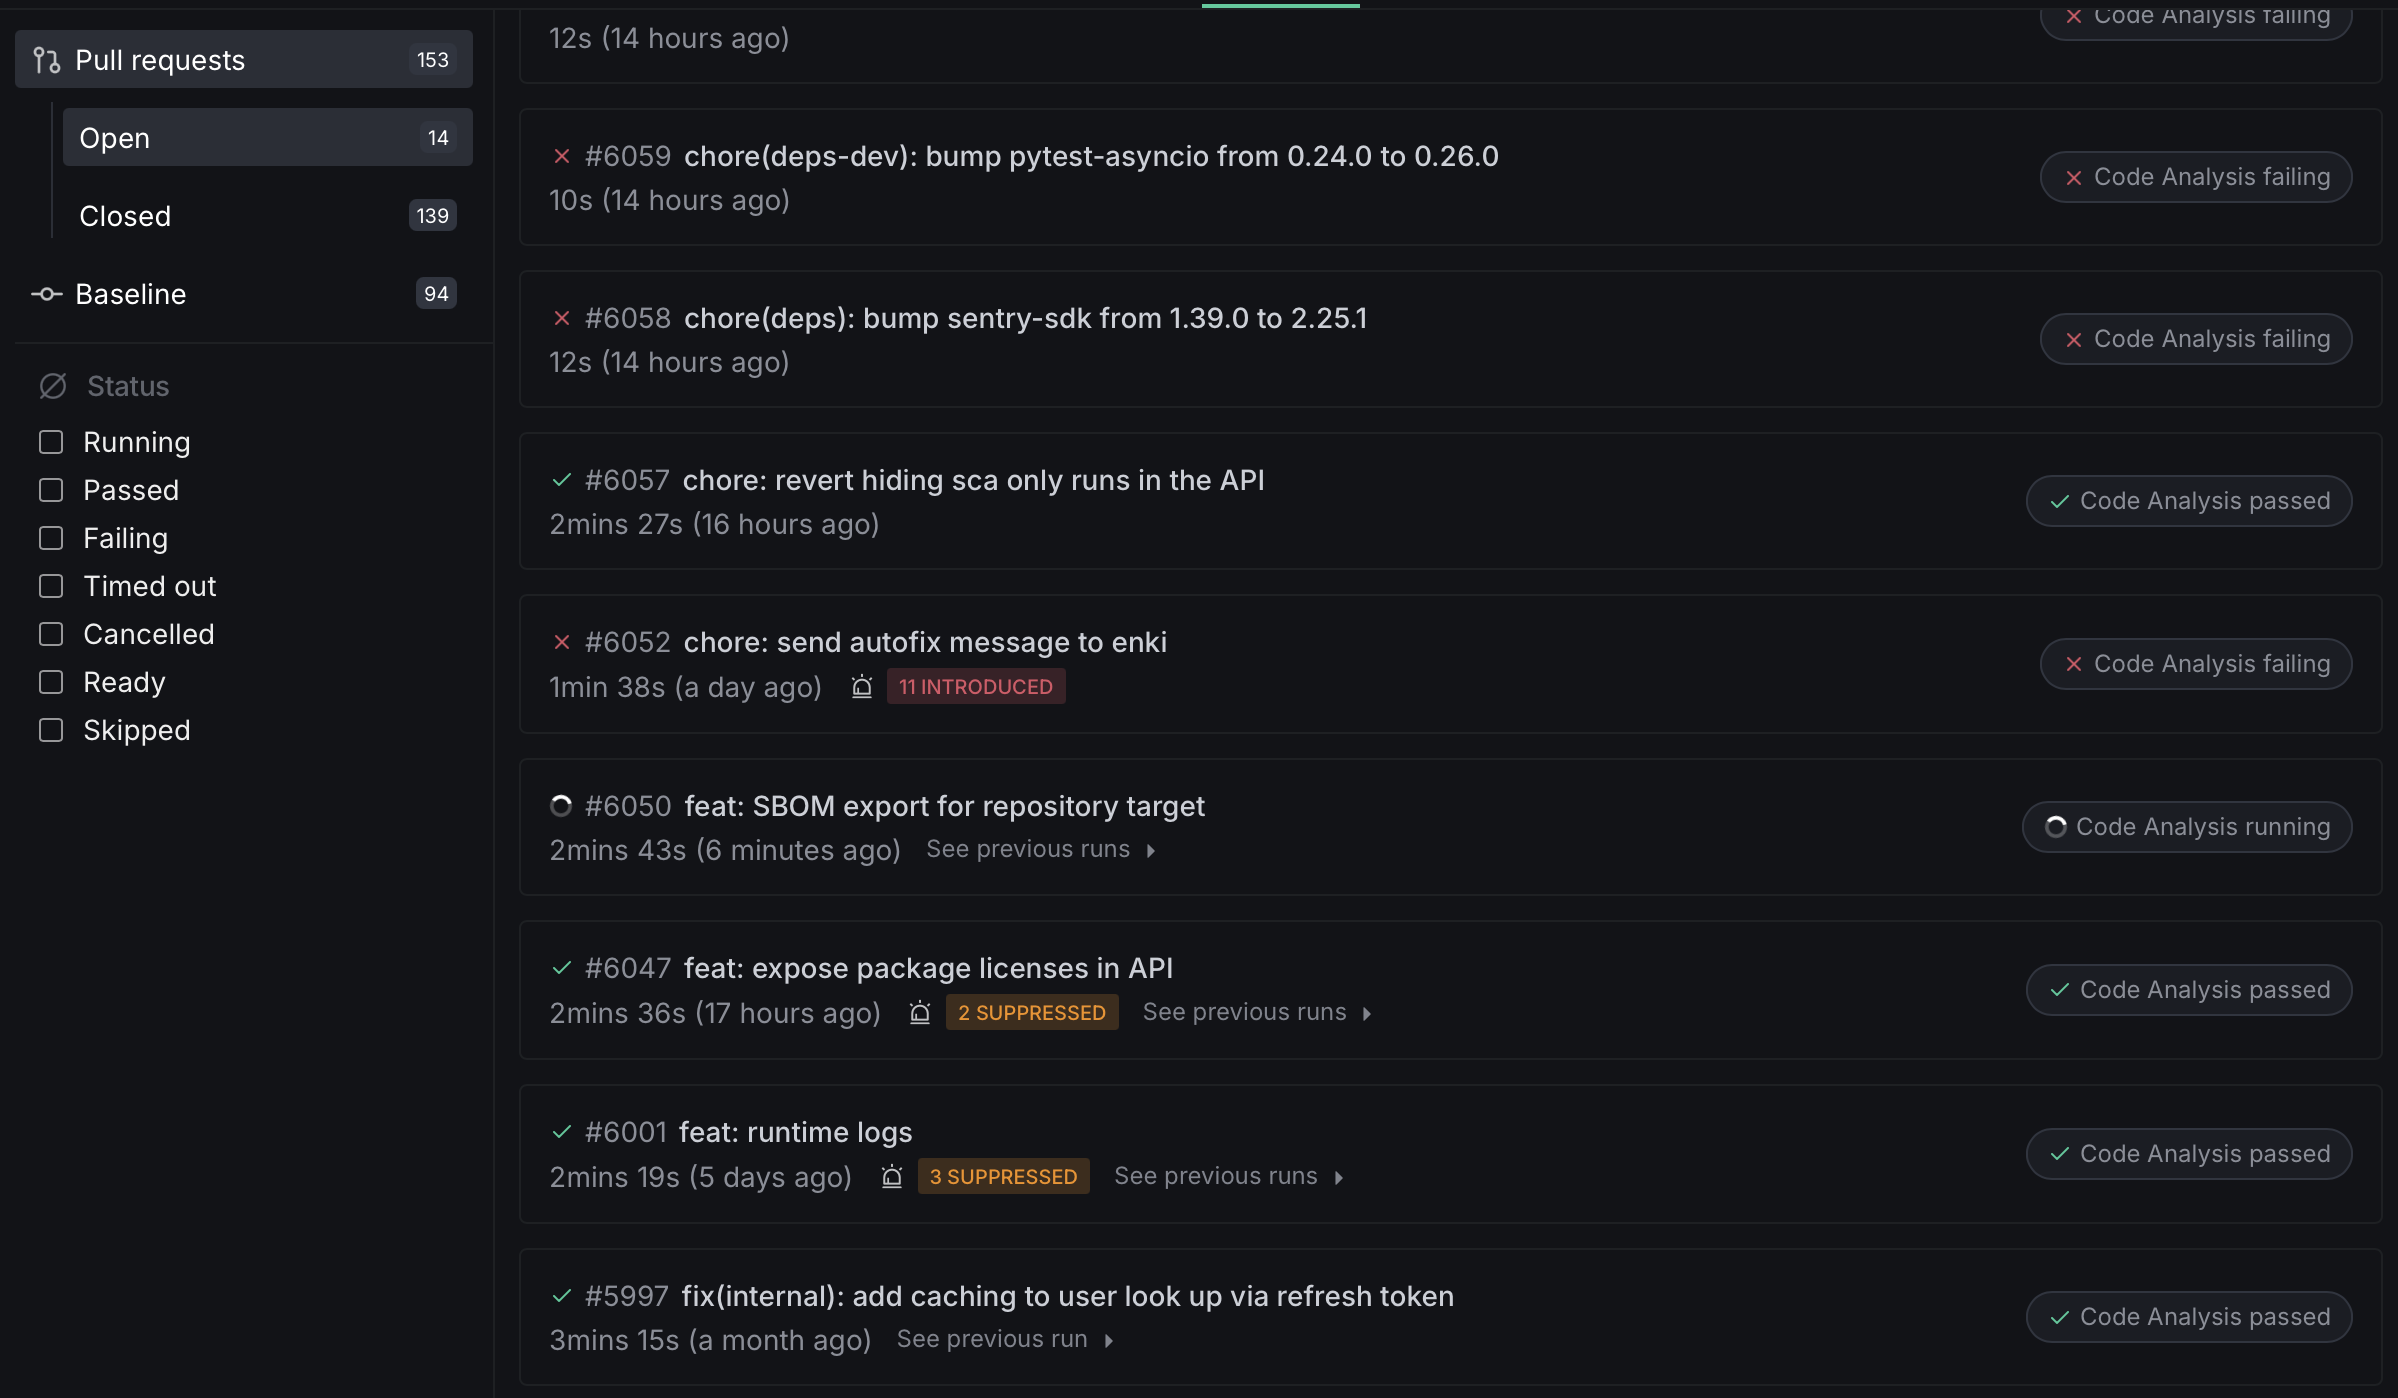
The History tab provides a record of all the DeepSource runs conducted on the repository. It includes information about the Code Analysis runs, SCA runs, an overview of issues and metrics detected, and the status of pull requests. This tab is accessible from the Repository page.
Report Card
The Report Card is available for pull request runs. When you click on a pull request from the history list, the Report Card grades the change across five quality dimensions — Security, Reliability, Complexity, Hygiene, and Coverage — and rolls them up into a single aggregate letter grade. It surfaces actionable feedback alongside per-dimension grades and the aggregate score.
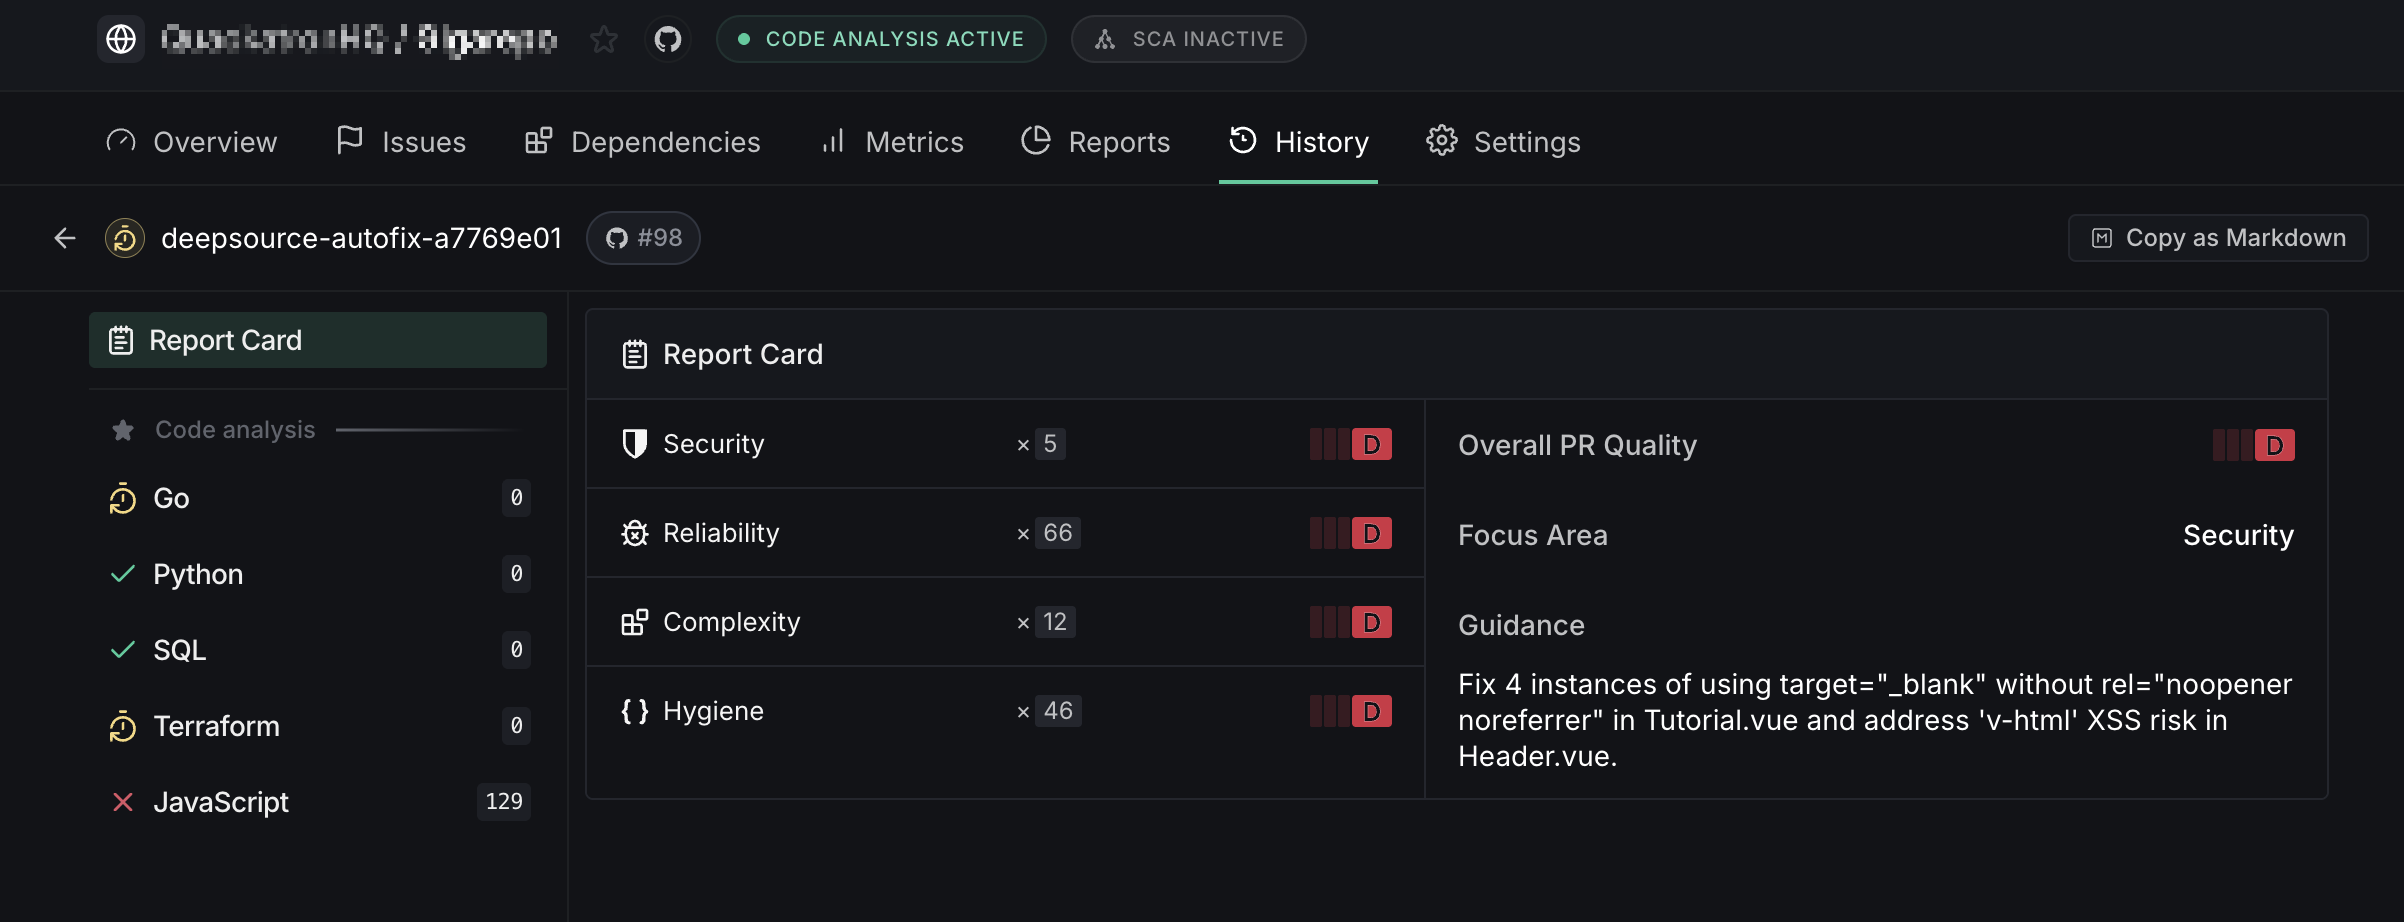
The Report Card view is split into two sections:
- Feedback — a list of AI-generated insights summarizing the most important findings from the run.
- Summary sidebar — the aggregate grade, the Focus Area, and letter grades for each quality dimension.
The Report Card is only available for pull request runs. For default branch runs, the history view shows individual analyzer results directly.
Quality dimensions
| Dimension | What it measures |
|---|---|
| Security | Vulnerabilities, exposed secrets, and insecure patterns in the code |
| Reliability | Risk of runtime failures — unhandled errors, resource leaks, edge cases |
| Complexity | How easy the code is to understand and maintain |
| Hygiene | Cleanliness — dead code, unused imports, duplication, debug leftovers |
| Coverage | Test coverage for the changed code |
Coverage is only shown when you have coverage reporting configured. It does not affect the aggregate grade.
Grading
Each dimension receives a letter grade — A, B, C, or D. Dimensions with no analyzable data for the pull request show a — grade and are excluded from the aggregate calculation. Grades are weighted by issue severity; critical issues have a larger impact on the grade than low-severity ones.
Aggregate grade
The aggregate grade combines the four core dimensions (Security, Reliability, Complexity, and Hygiene) into a single letter grade. Coverage is excluded from the aggregate so that repositories without coverage reporting are not penalized.
Critical security issues or exposed secrets can cap the aggregate at a lower grade regardless of how well the other dimensions score.
Using the Report Card with AI coding agents
The Report Card includes a Focus Area — the single dimension with the highest impact on the overall grade. Fixing issues in the Focus Area first gives you the largest quality improvement per change.
There are two ways to feed Report Card data into an AI coding agent:
- Copy as Markdown — export the full report from the UI and paste it into your agent's context.
- GraphQL API — query the report programmatically to integrate it into automated workflows.
Start by asking your AI coding agent to fix the issues in the Focus Area dimension. This targets the highest-impact problems first and moves the aggregate grade up the fastest.
Analysis Detail View
Clicking on a specific analyzer from the summary sidebar shows a detailed breakdown of that analyzer's results:
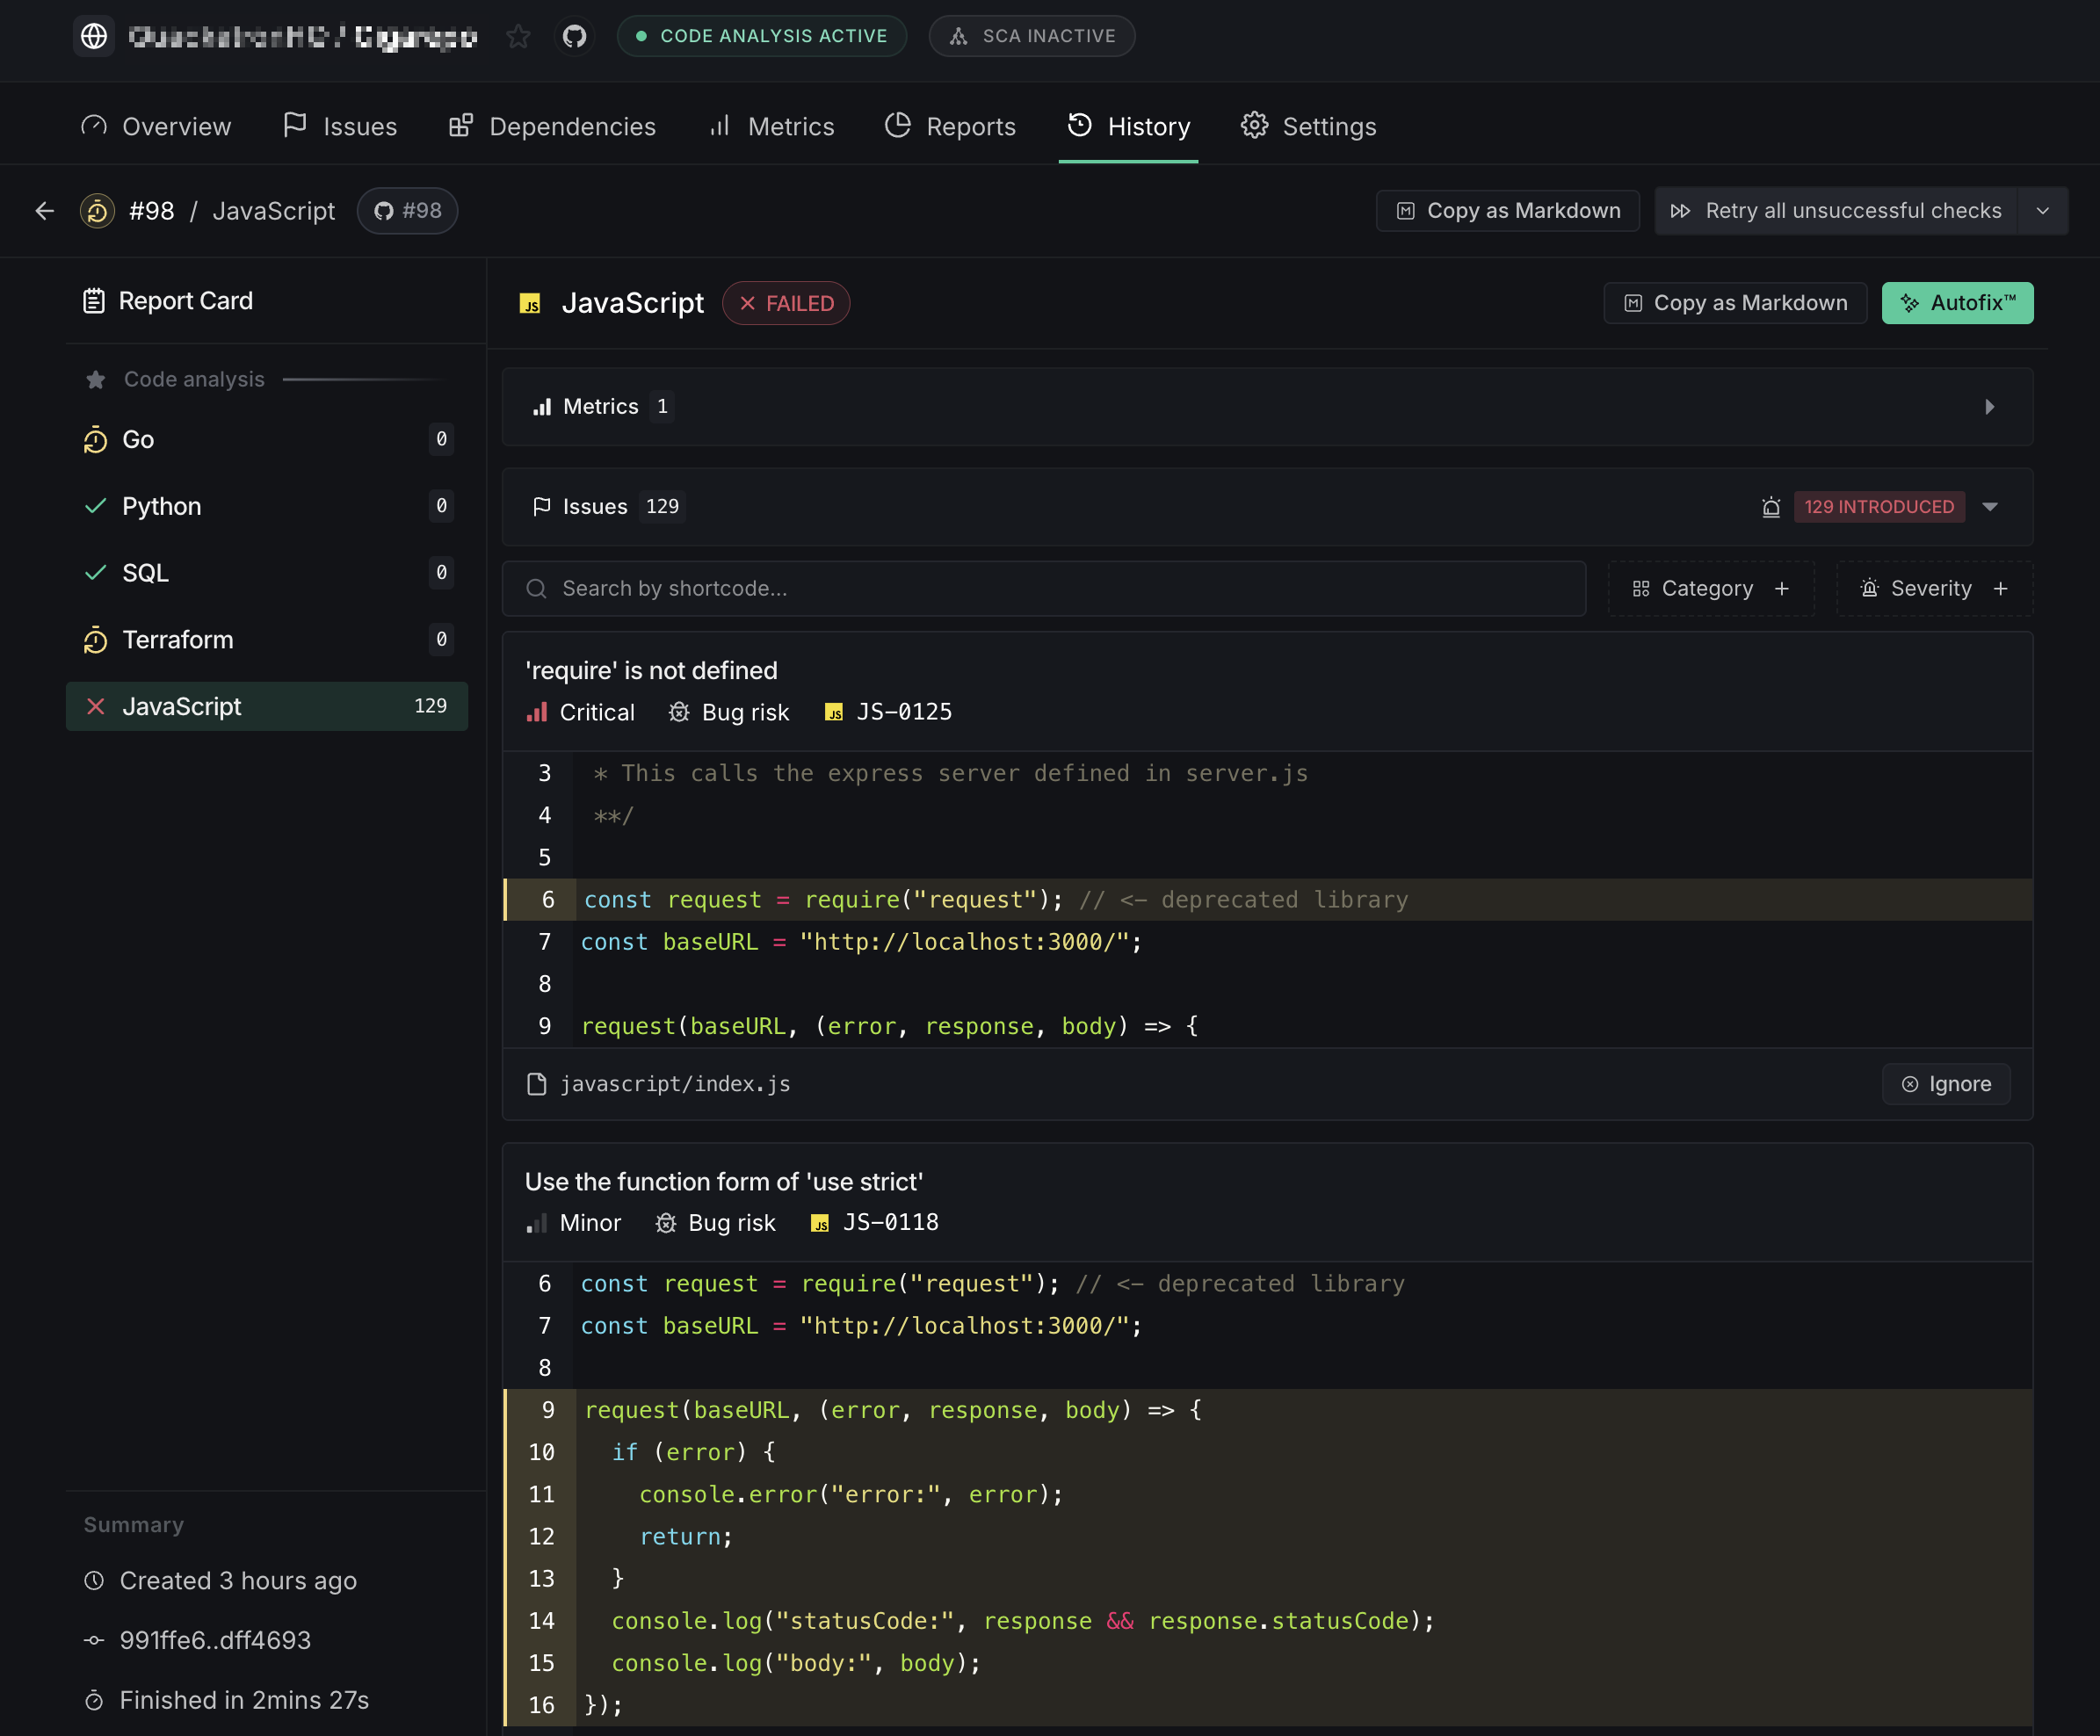
Use the filter controls at the top to narrow issues by shortcode, category, or severity.
Copy as Markdown
The Copy as Markdown split button lets you export analysis results as structured Markdown, ready to paste into AI coding assistants, GitHub issues, or any other tool that supports Markdown.
The button appears in the run header across all run detail pages. Clicking the primary button copies the complete review. The dropdown arrow opens a menu with three export scopes:
- Full code review (run-level export): Copies a summary across all analyzers and SCA targets in the run. To keep the output manageable, each issue includes up to 25 occurrences.
- Analyzer review (check-level export): Copies results for a single analyzer with no truncation — every occurrence is included. One entry appears per analyzer in the run.
- SCA target review (check-level export): Copies results for a single SCA dependency target with no truncation. One entry appears per SCA target in the run.
The exported Markdown includes:
- Run metadata — repository name, branch, commit SHA, and run timestamp
- Per-analyzer summary — analyzer name, status (pass/fail), and issue count
- Per-issue details — shortcode, title, category, severity, and description
- Code occurrences — file path, line numbers, and a code snippet
- Coverage occurrences — file path and line range
- Coverage metrics — line, branch, and condition coverage where available
- Grouped summary — issues grouped by analyzer for quick scanning
Paste the exported Markdown directly into AI coding assistants like Claude Code, Cursor, Windsurf, or GitHub Copilot to get contextual fix suggestions for detected issues. It also works well in GitHub issue descriptions, pull request comments, or team chat threads.
The button is disabled while an analysis run is still in progress. Code snippets are truncated to 30 lines per occurrence, and run-level exports cap each issue at 25 occurrences.
Ignore an occurrence of an issue
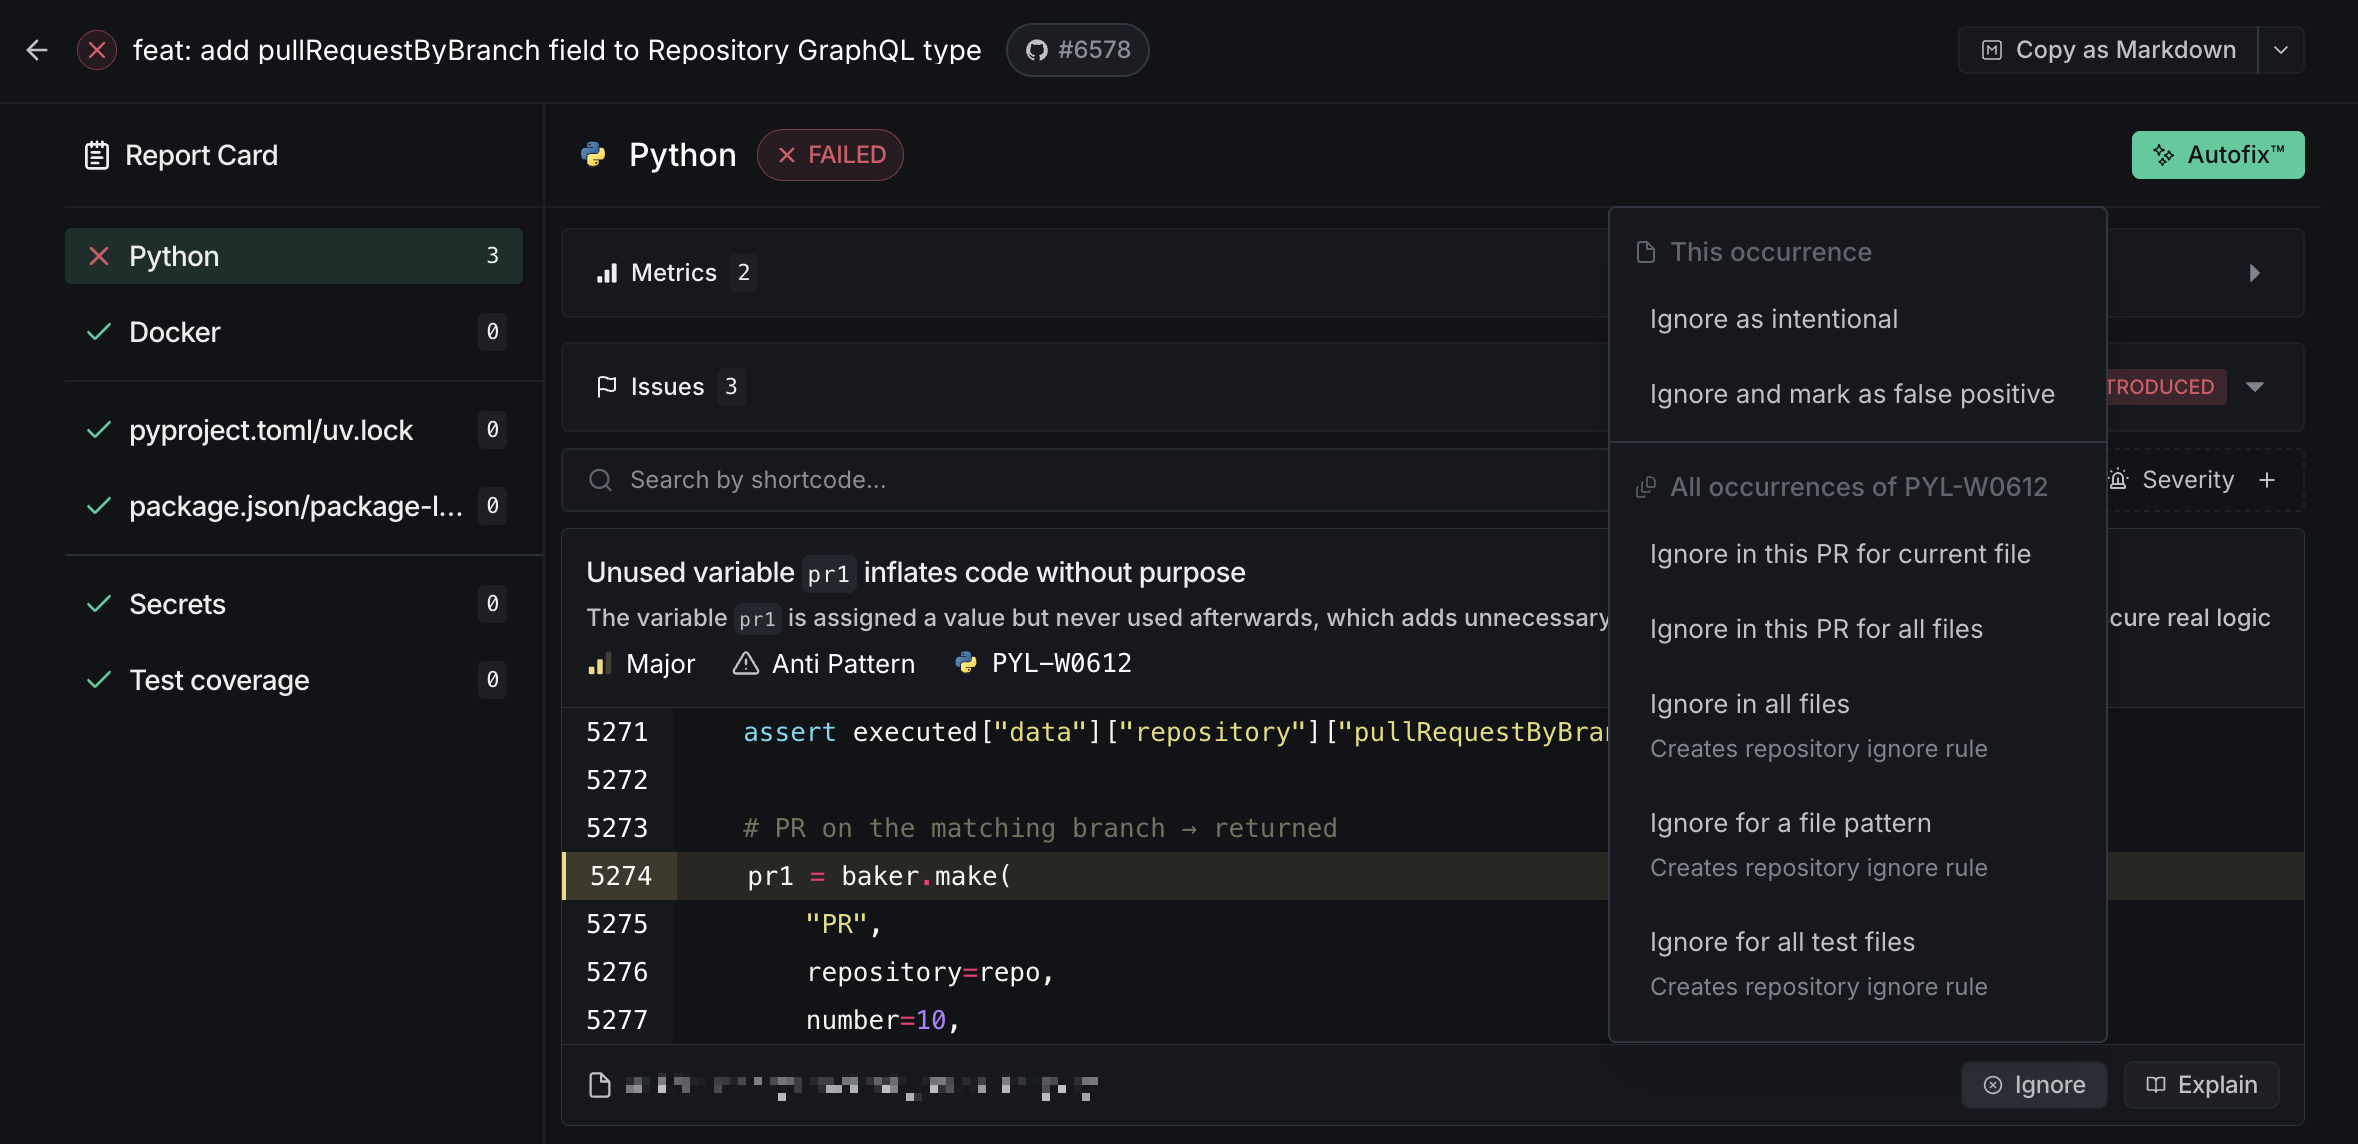
You can ignore issues directly from the issue card in the Issues tab. The ignore dropdown offers several scopes:
- This occurrence — Mark a single occurrence as intentional or as a false positive
- All occurrences — Ignore every occurrence of that specific issue code
- In this PR — Ignore in the current file only, or across all files in the pull request
- Repository-wide — Ignore in all files, for a file pattern, or for all test files
See Ignoring issues for full details.
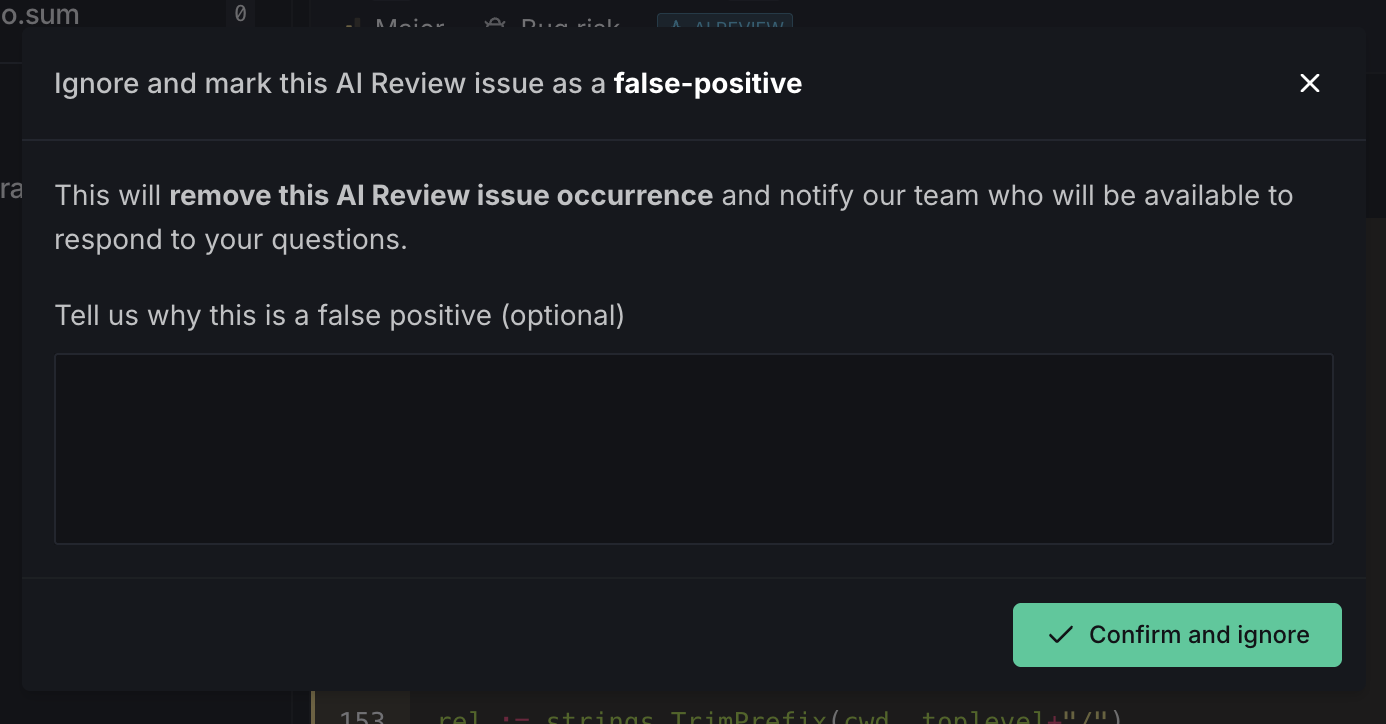
AI Review false positives
AI Review issues have a dedicated false positive reporting flow, separate from the static analysis ignore dropdown. When you click the ignore button on an AI Review issue, a modal opens where you can mark the issue as a false positive and optionally leave a comment explaining why. This feedback helps improve AI Review accuracy over time.
Autofix™
When you trigger Autofix for an issue, the resulting session appears in the History tab.
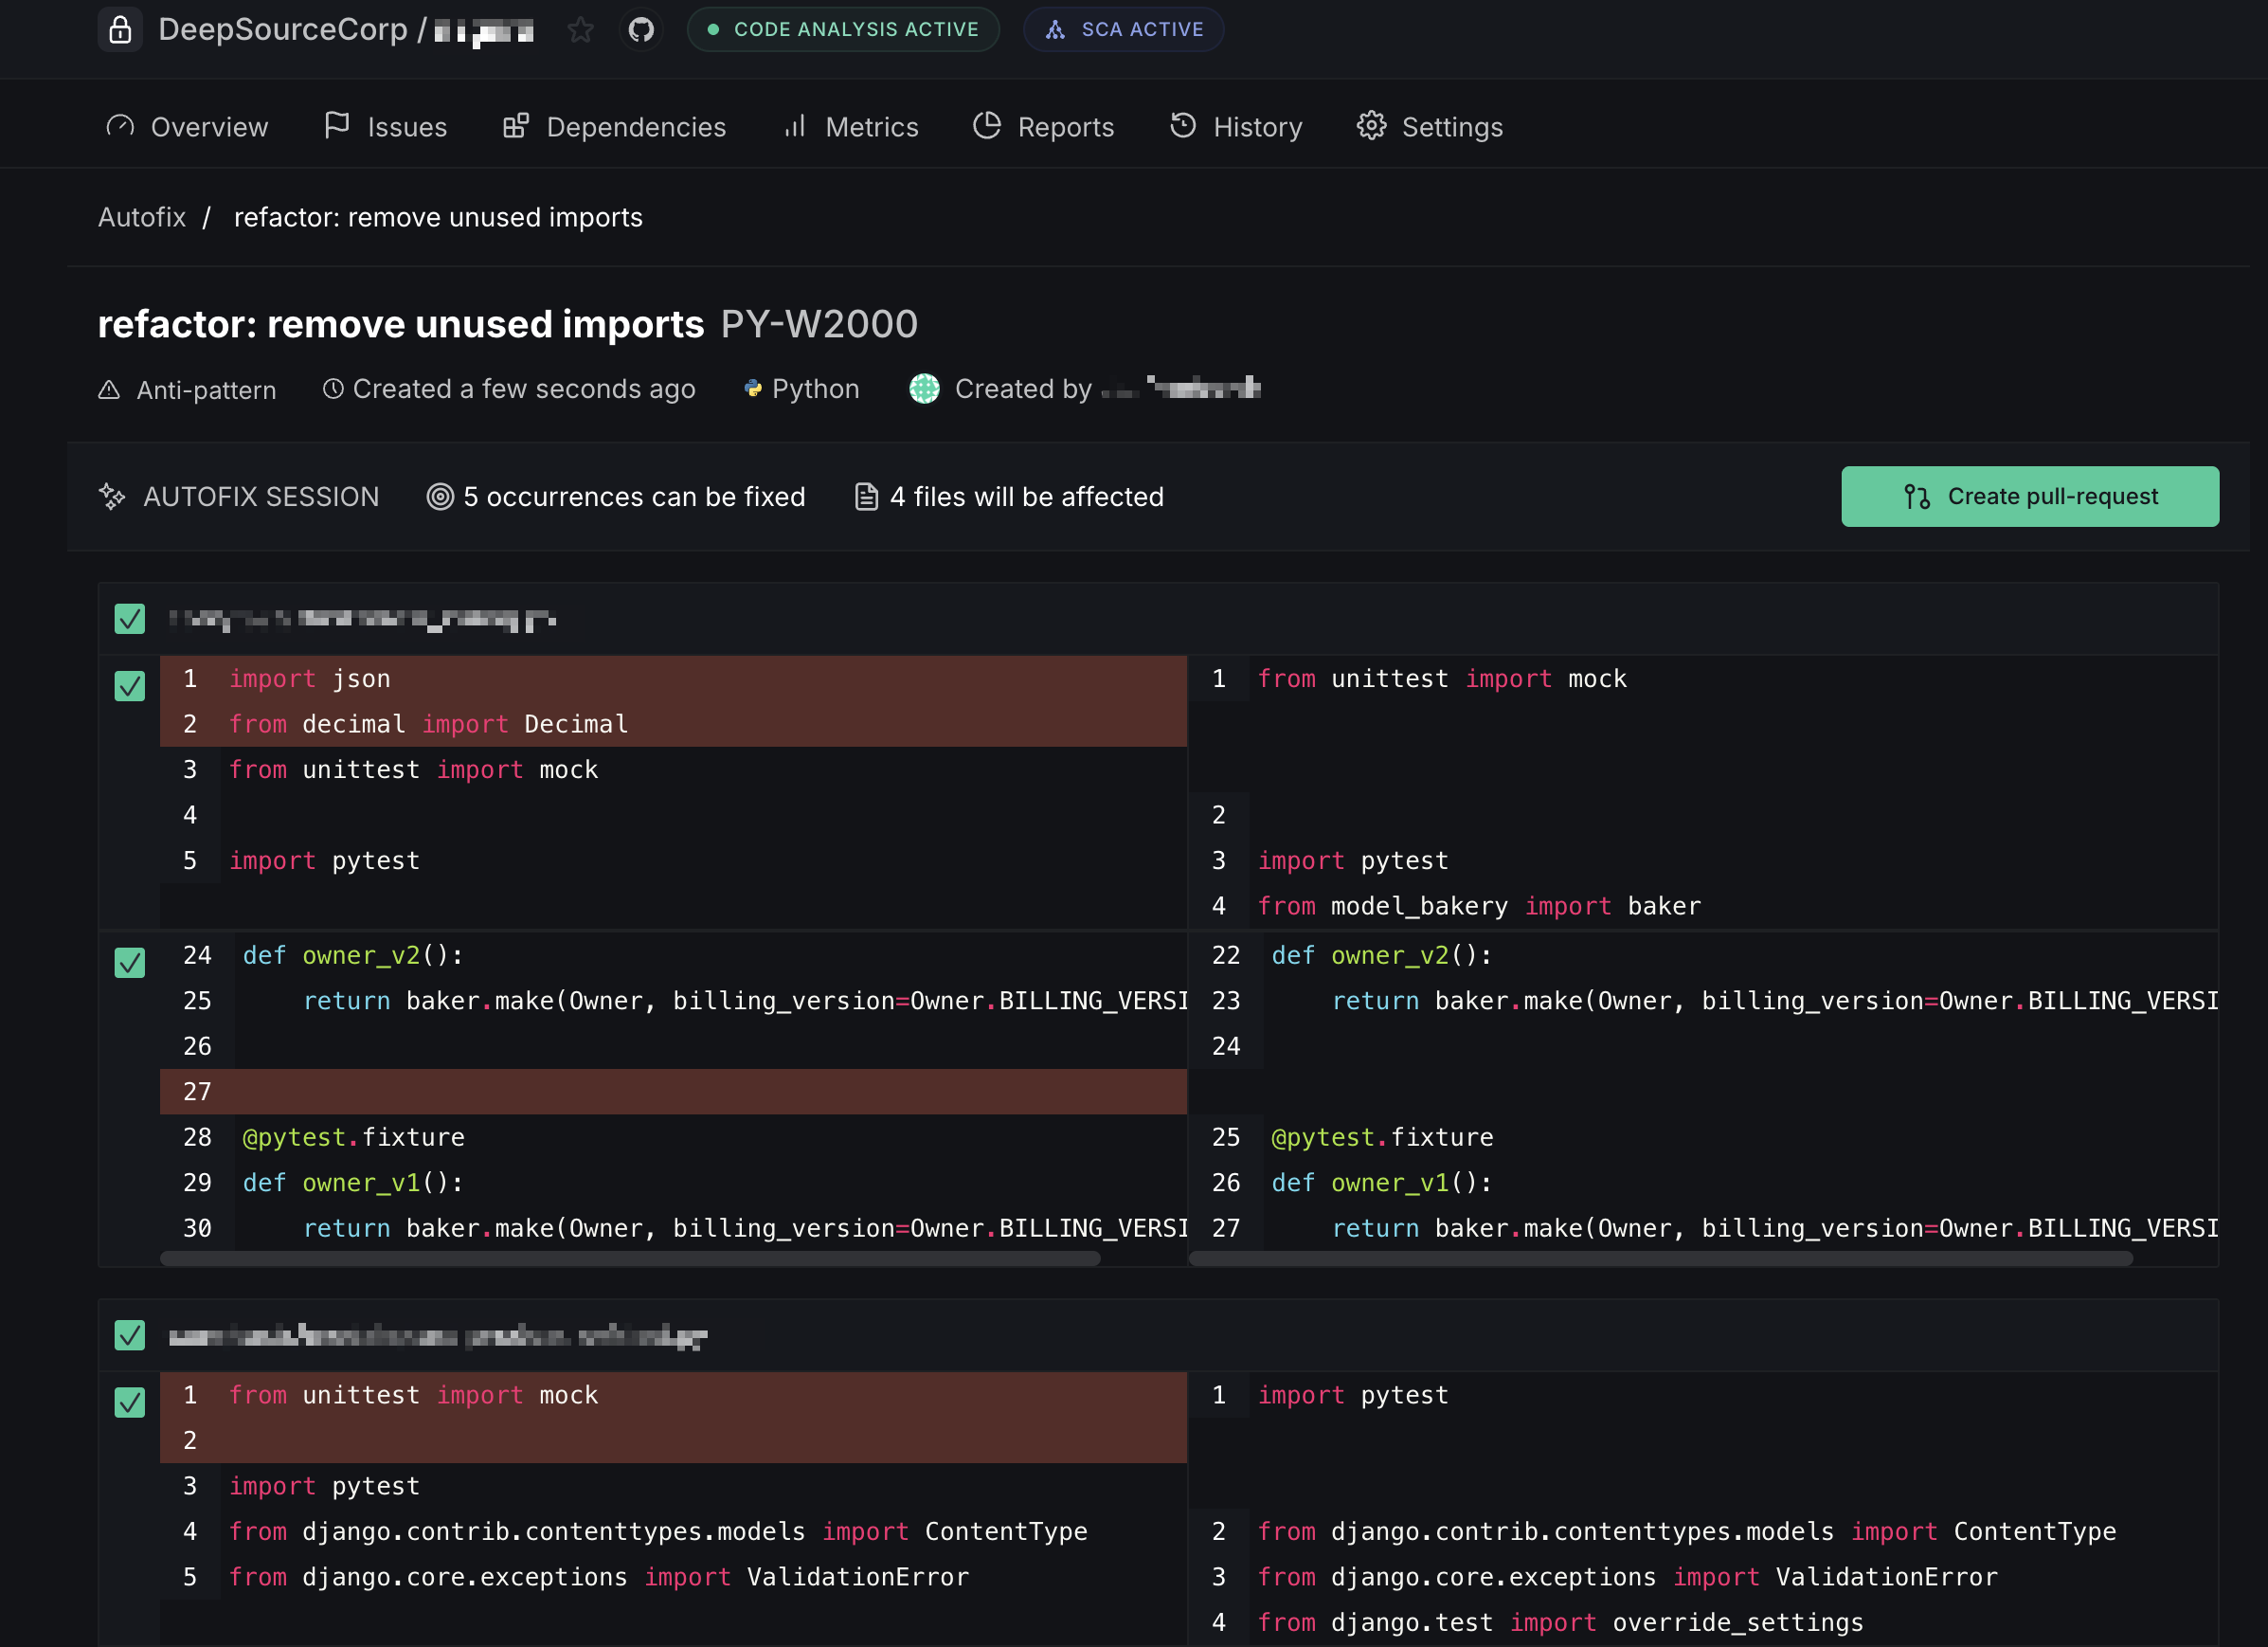
- Create pull request — when Autofix is triggered from a default-branch analysis, the fixes are submitted as a new PR
- Commit to pull request — when triggered from an existing PR's analysis, the fixes are committed directly onto that PR's branch
Suppress metrics
By setting a threshold and enabling enforcement in the repository settings, pull request runs will fail if the threshold conditions aren't met. However, you can choose to suppress a metric from the Analysis Runs page in the History tab, which will unblock the pull request on your version control provider.
Retry analysis runs
Analysis checks that timed out or errored out can be retried manually from the UI. You can choose to retry an individual check or all unsuccessful checks in the analysis run. This operation is restricted to users with WRITE access to the repository.
Skip analysis runs
Code Formatting and analysis checks on a commit can be skipped by adding any of the following strings to the commit message:
[skip ci][ci skip][no ci][skipcq]